25 X 25 Times Table Chart - Math Learning Center
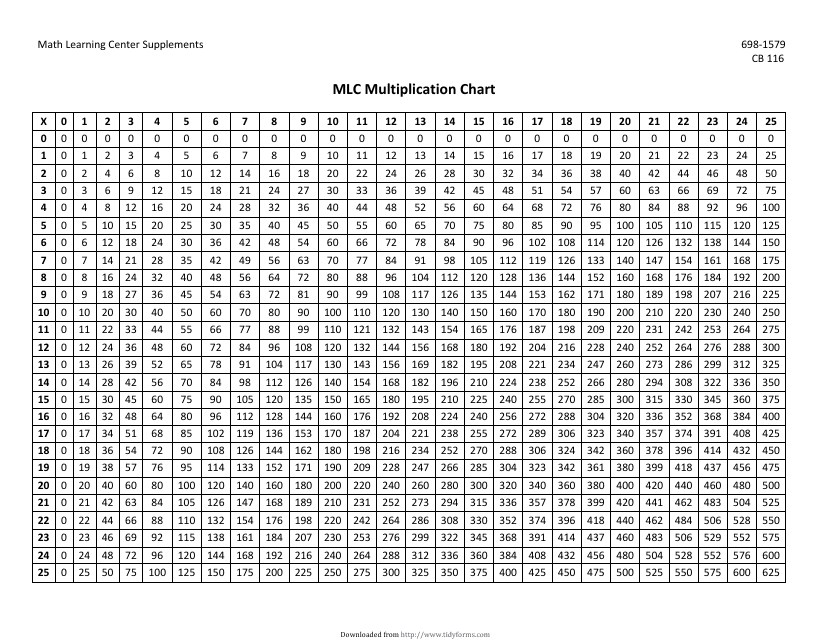
The 25 X 25 Times Table Chart is designed to help students learn and practice multiplication by providing a visual representation of the multiplication facts from 1 to 25.
FAQ
Q: What is a 25 x 25 times table chart?
A: A 25 x 25 times table chart is a table that shows the multiplication facts for numbers from 1 to 25.
Q: Why would someone use a 25 x 25 times table chart?
A: A 25 x 25 times table chart can be used for learning and practicing multiplication facts up to 25.
Q: How can I use a 25 x 25 times table chart?
A: You can use a 25 x 25 times table chart by looking for the number you want to multiply in the left column and then finding the corresponding product in the row.
Q: What is the benefit of using a 25 x 25 times table chart?
A: Using a 25 x 25 times table chart can help improve multiplication skills and make it easier to solve math problems involving larger numbers.


