Blank Pie Chart With 7 Slices
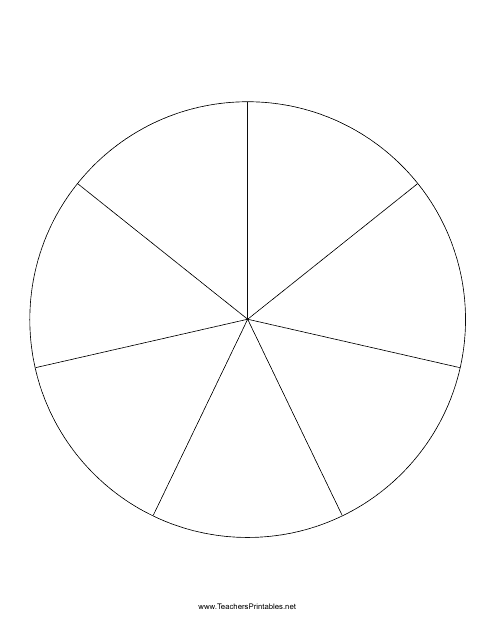
A blank pie chart with 7 slices is a visual representation of data that can be used to display the distribution or proportion of different categories or variables. It allows you to divide the whole into seven parts and visually compare the sizes of these parts. The purpose of a blank pie chart with 7 slices can vary depending on the specific context or data being represented. It could be used for business analysis, market research, budget allocation, academic research, or any situation where you need to visually represent data and compare the proportions of different categories.
The blank pie chart with 7 slices is typically filed by the person or entity responsible for creating or designing the chart. This could be a graphic designer, data analyst, or any individual or organization that requires a visual representation of data. The purpose of filing the blank pie chart is to provide a template or framework for filling in the data points or categories that will be represented in the chart.
FAQ
Q: How many slices does a blank pie chart with 7 slices have?
A: A blank pie chart with 7 slices is divided into 7 equal sections or slices.
Q: What can be represented using a blank pie chart with 7 slices?
A: A blank pie chart with 7 slices can be used to represent various types of data or categories, such as percentages, proportions, or distribution of different elements.
Q: How can a blank pie chart with 7 slices be utilized?
A: A blank pie chart with 7 slices can be utilized for data visualization, analysis, or comparisons between different categories or parts of a whole.
Q: Are the slices in a blank pie chart with 7 slices equal in size?
A: Yes, in a blank pie chart with 7 slices, all the slices are of equal size to ensure a fair representation of the data.
Q: Is it possible to customize the colors of the slices in a blank pie chart with 7 slices?
A: Yes, you can customize the colors of the slices in a blank pie chart with 7 slices to make the visual representation more appealing or to highlight specific categories.
Q: Can I label the slices in a blank pie chart with 7 slices?
A: Absolutely! It's recommended to label each slice to provide clear identification of the categories being represented.
Q: What are some common uses of a blank pie chart with 7 slices?
A: A blank pie chart with 7 slices can be used in various fields like business, marketing, finance, education, and research, to visualize data such as market share, demographic distribution, budget allocation, or academic performance.
