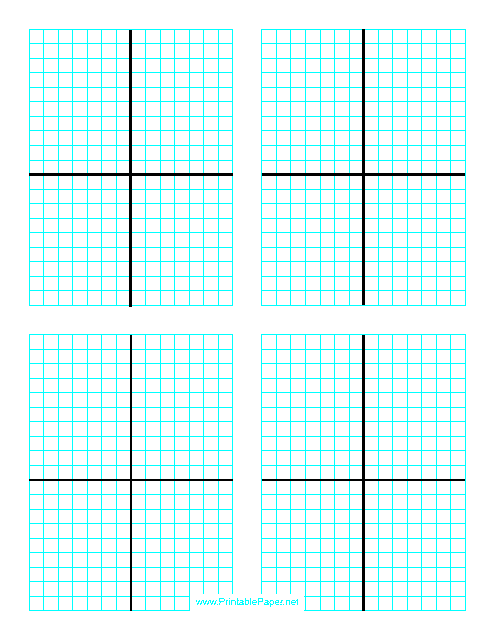
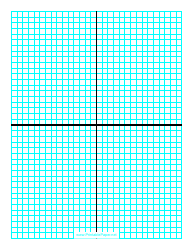
Graph Paper Template With Axis
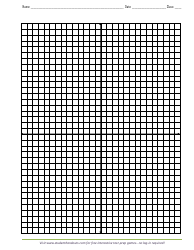
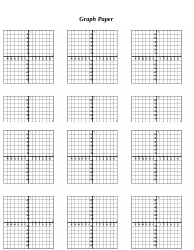
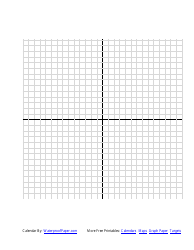
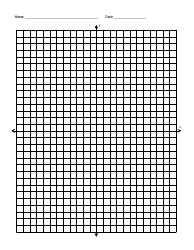
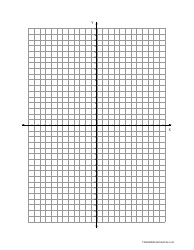
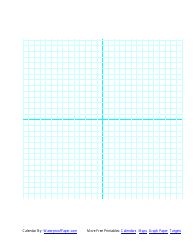
A Graph Paper Template With Axis is a tool commonly used in mathematics, engineering, and arts. This template provides a grid structure consisting of horizontal and horizontal lines, with an 'X' and 'Y' axis.
In mathematics, this template may help plot equations, data, and statistical probabilities. In engineering, it is often used to create diagrams, especially for geometric calculations. In arts, it may assist with creating precise two-dimensional designs like graphs and shapes. It is a great tool for visualizing data and mathematical functions.
Hence, a Graph Paper Template With Axis can be beneficial to students, engineers, architects, scientists, and artists who need to plot data, functions, designs, or drawings with precision and accuracy.
The Graph Paper Template With Axis is not specifically filed by any person, country, or institution. It's a universal template used in various fields such as mathematics, engineering, architecture, and more for plotting graphs, designing, drawing, etc. Anyone who needs it for these purposes can create, use or print such a template. It's not a legal or official document that needs to be filed with a particular entity.
FAQ
Q: What is a graph paper template with axis?
A: A graph paper template with axis is a pre-made grid that is generally used in mathematics and science. It contains both a horizontal X-axis and a vertical Y-axis. This template allows individuals to quickly plot data visually and see relationships and patterns.
Q: How can I use a graph paper template with axis?
A: This type of paper can be used for a variety of purposes in different academic fields. For example, in math, you may use it to plot equations or to showcase visual data in statistics. In a science lab, it might be used to graph experimental data. To use the template, identify your data points and correlate them to the axes, then plot each point on the grid.
Q: How can I create a graph paper template with axis?
A: You can create your own graph paper template with axis using software like Microsoft Excel. Open a new sheet, highlight cells to represent your graph paper, and choose the 'All Borders' option. For the axis, label one row and one column for X and Y parameters. You can even add increments or values as per your requirements.
