Finding Difference With Fractional Line Plots Worksheets With Answers
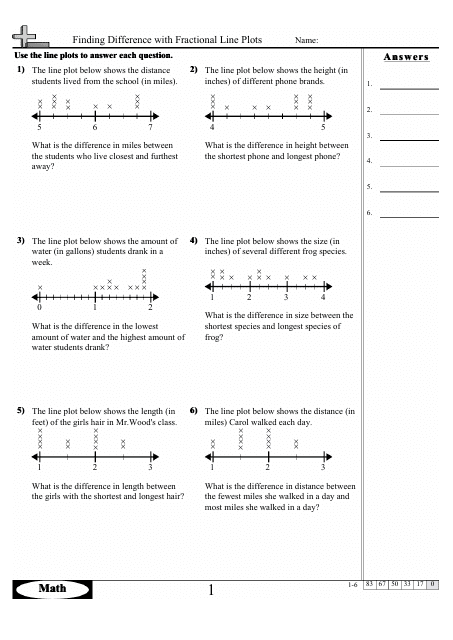
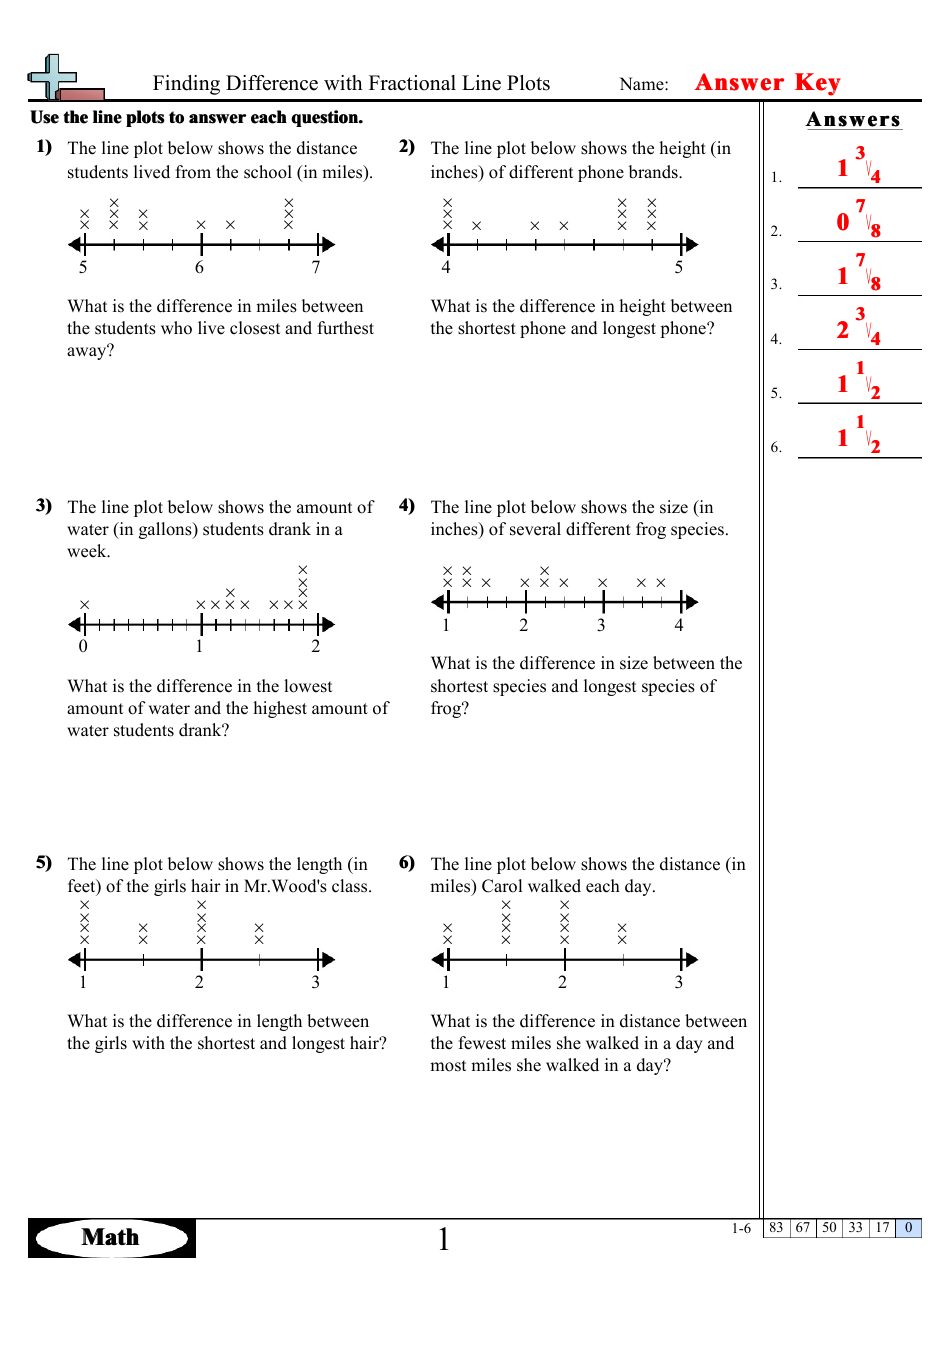
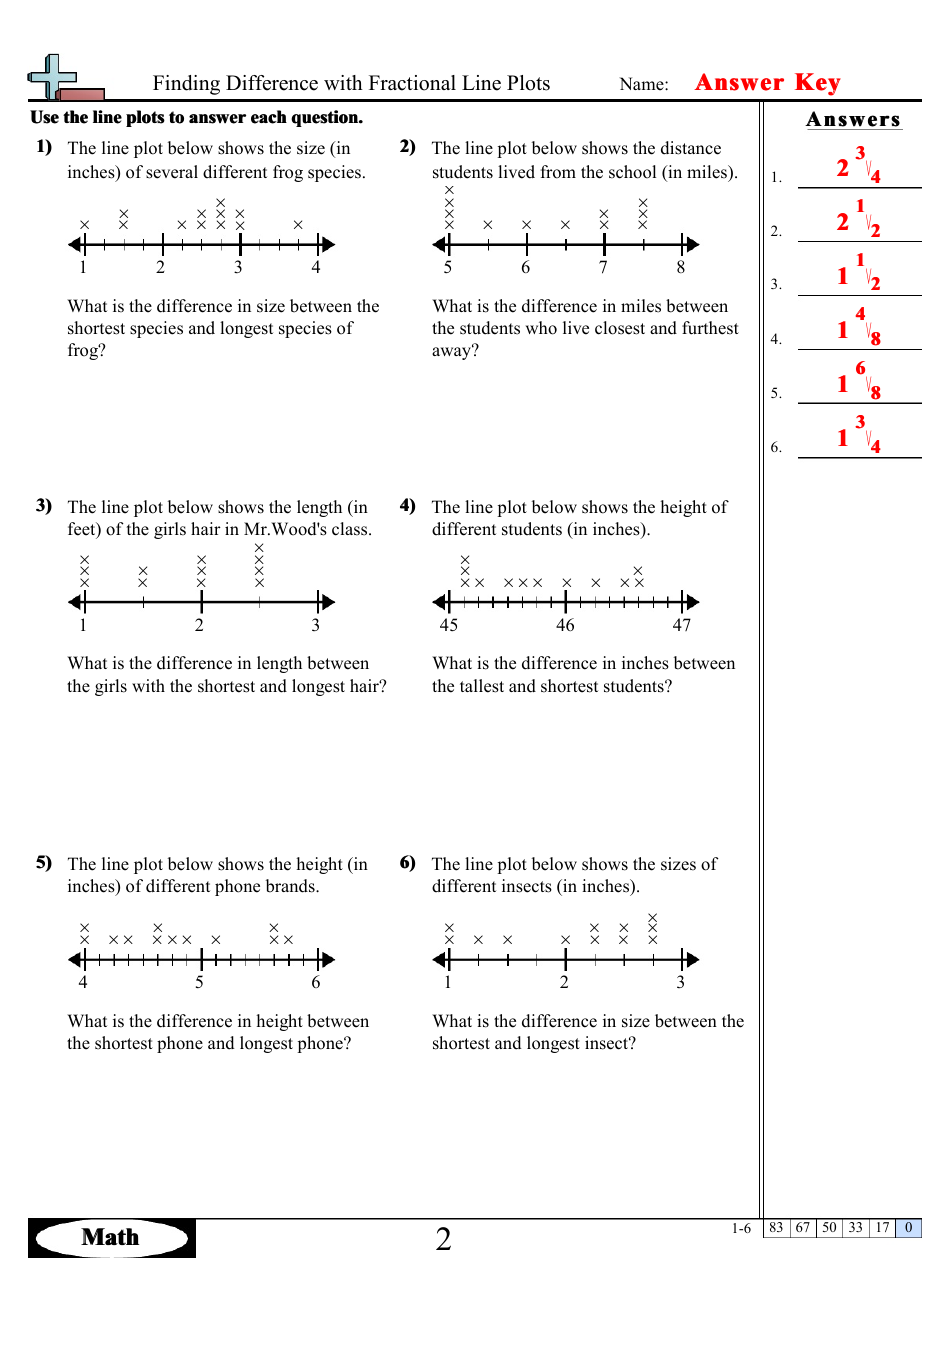
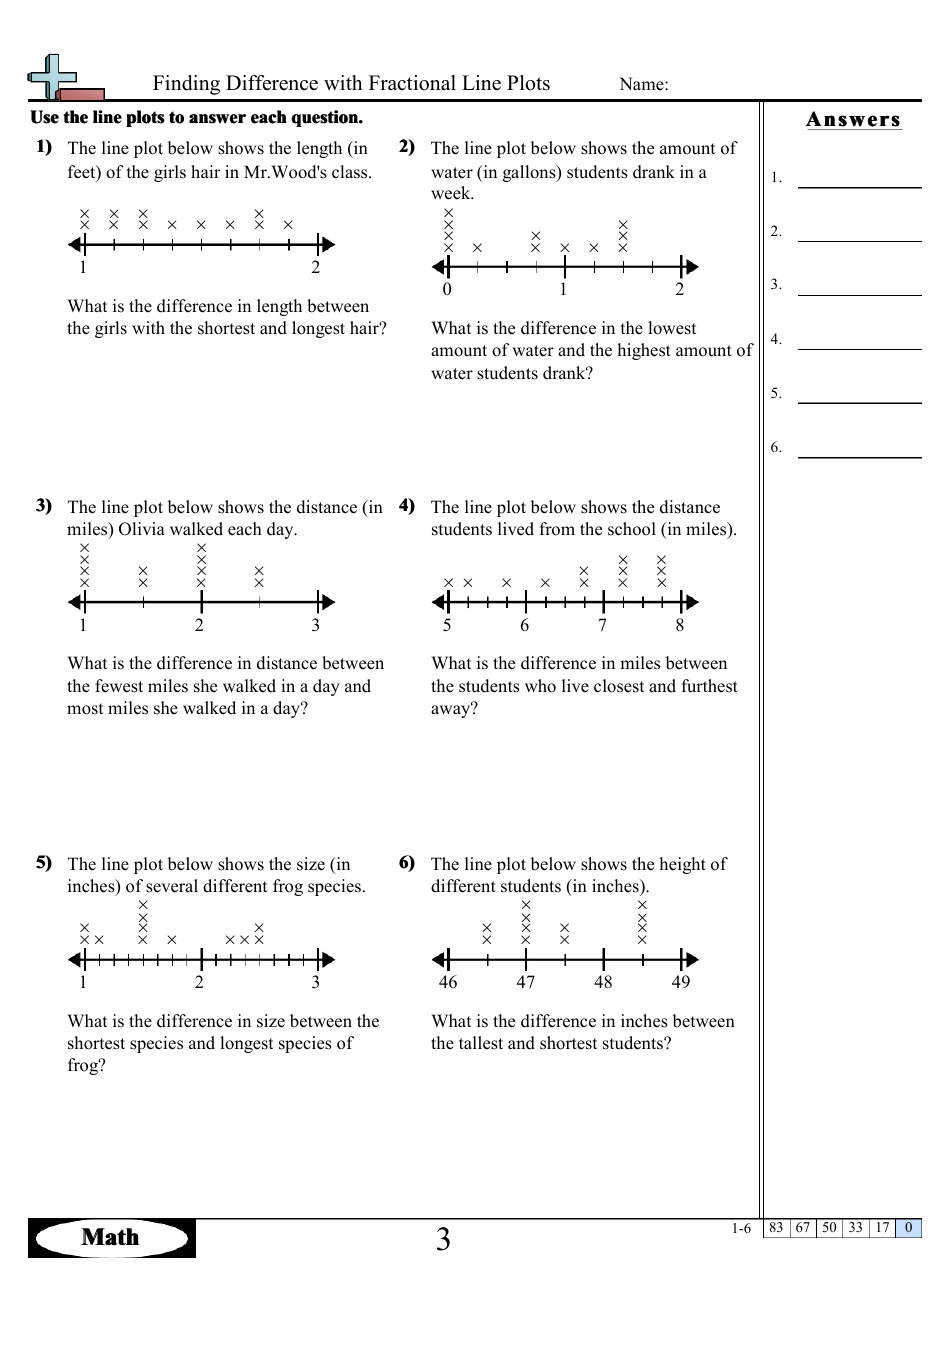
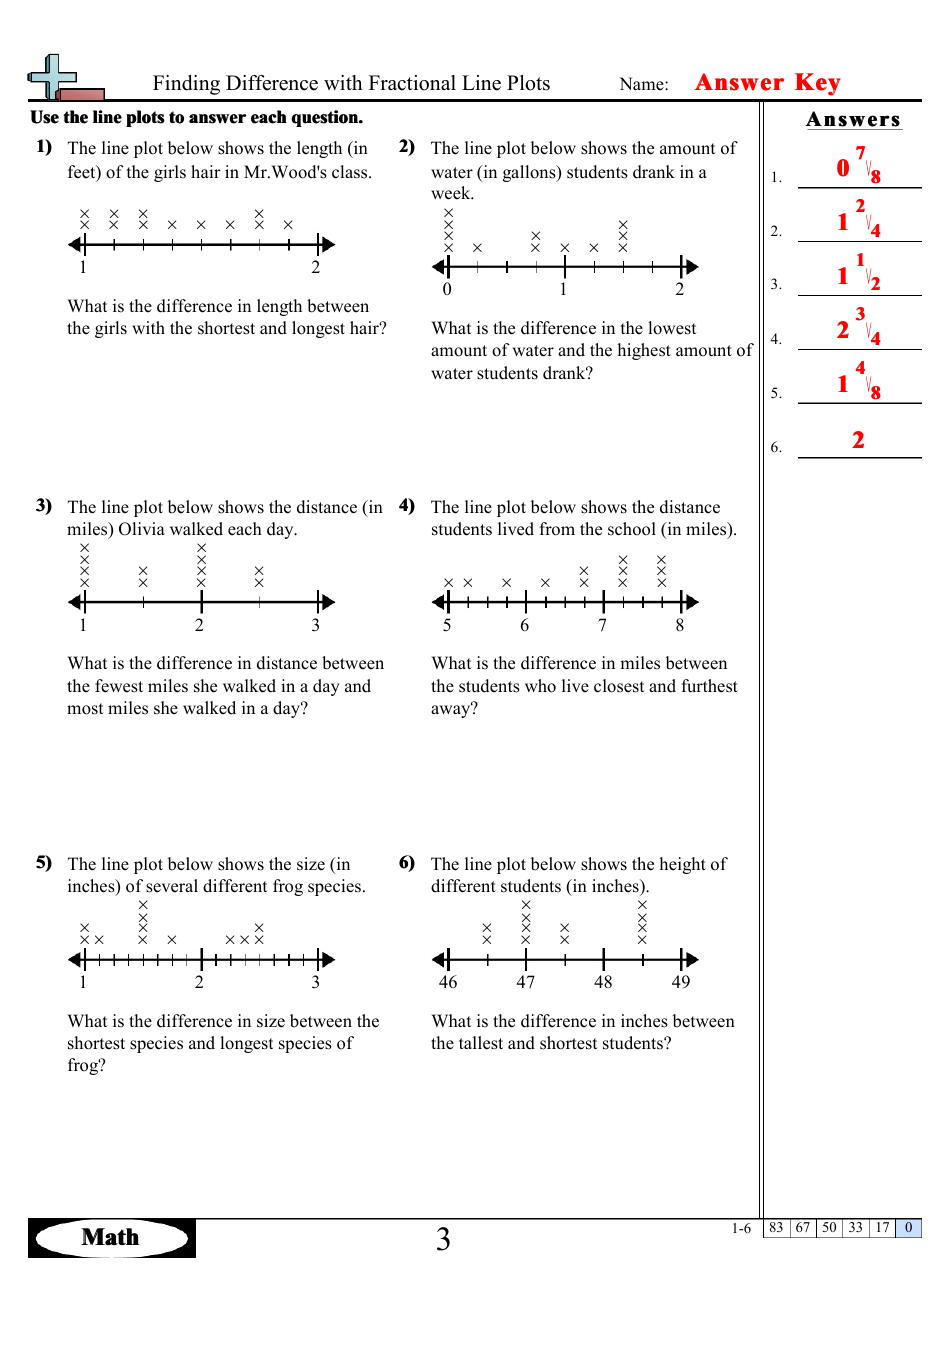
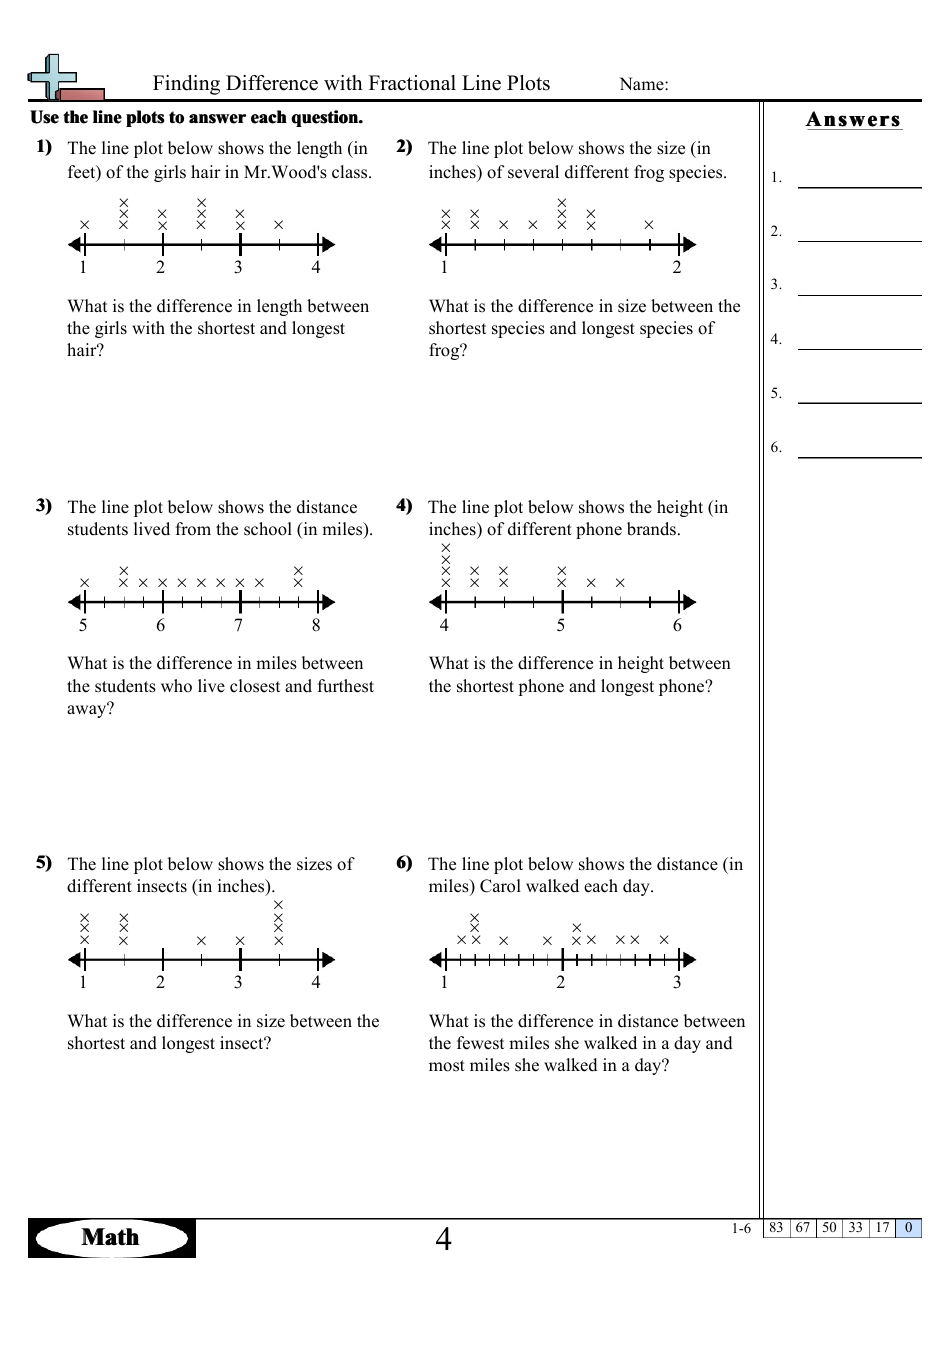
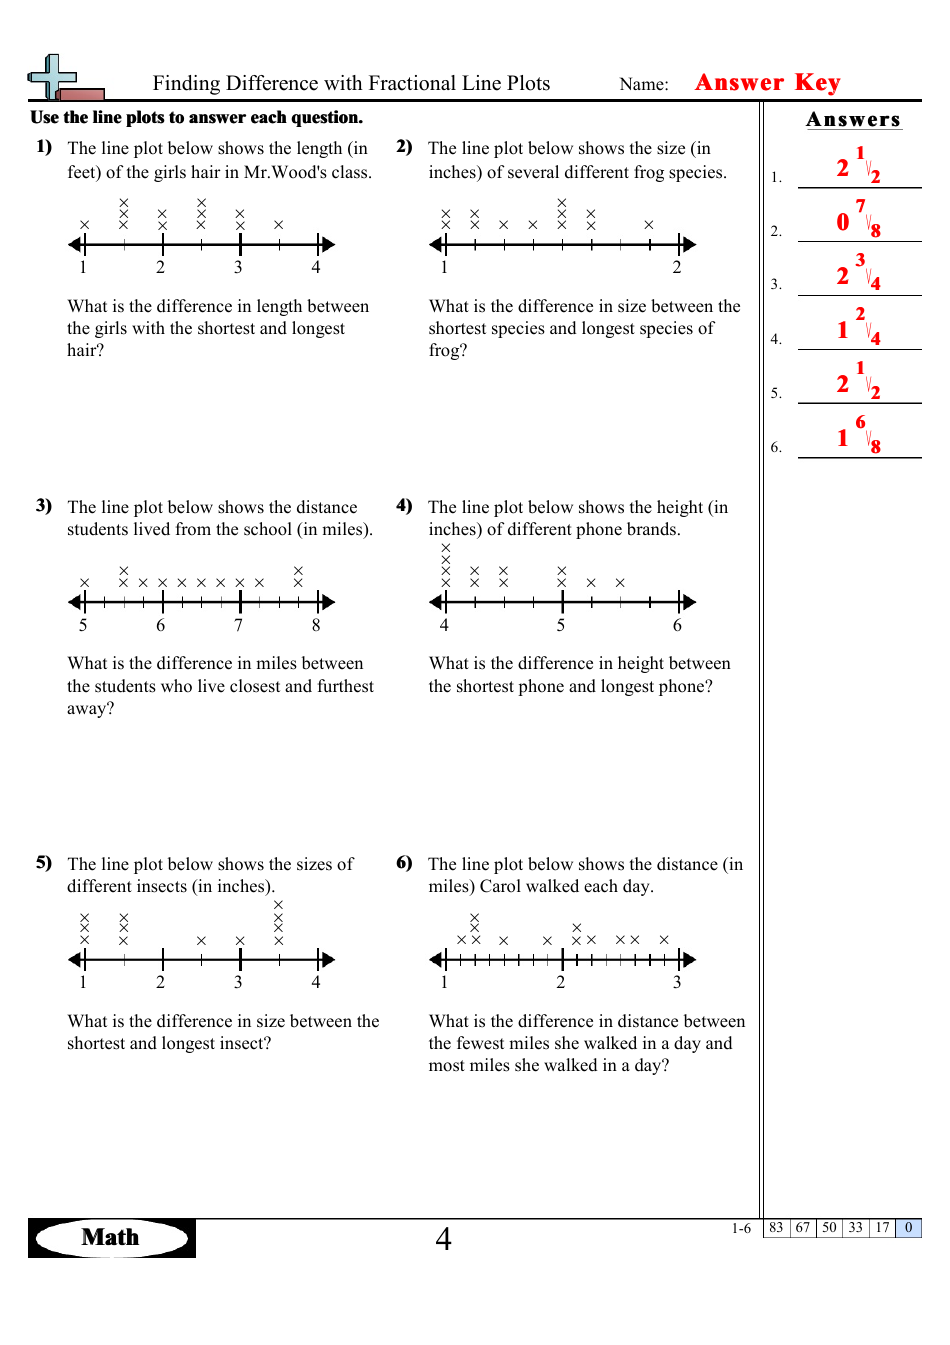
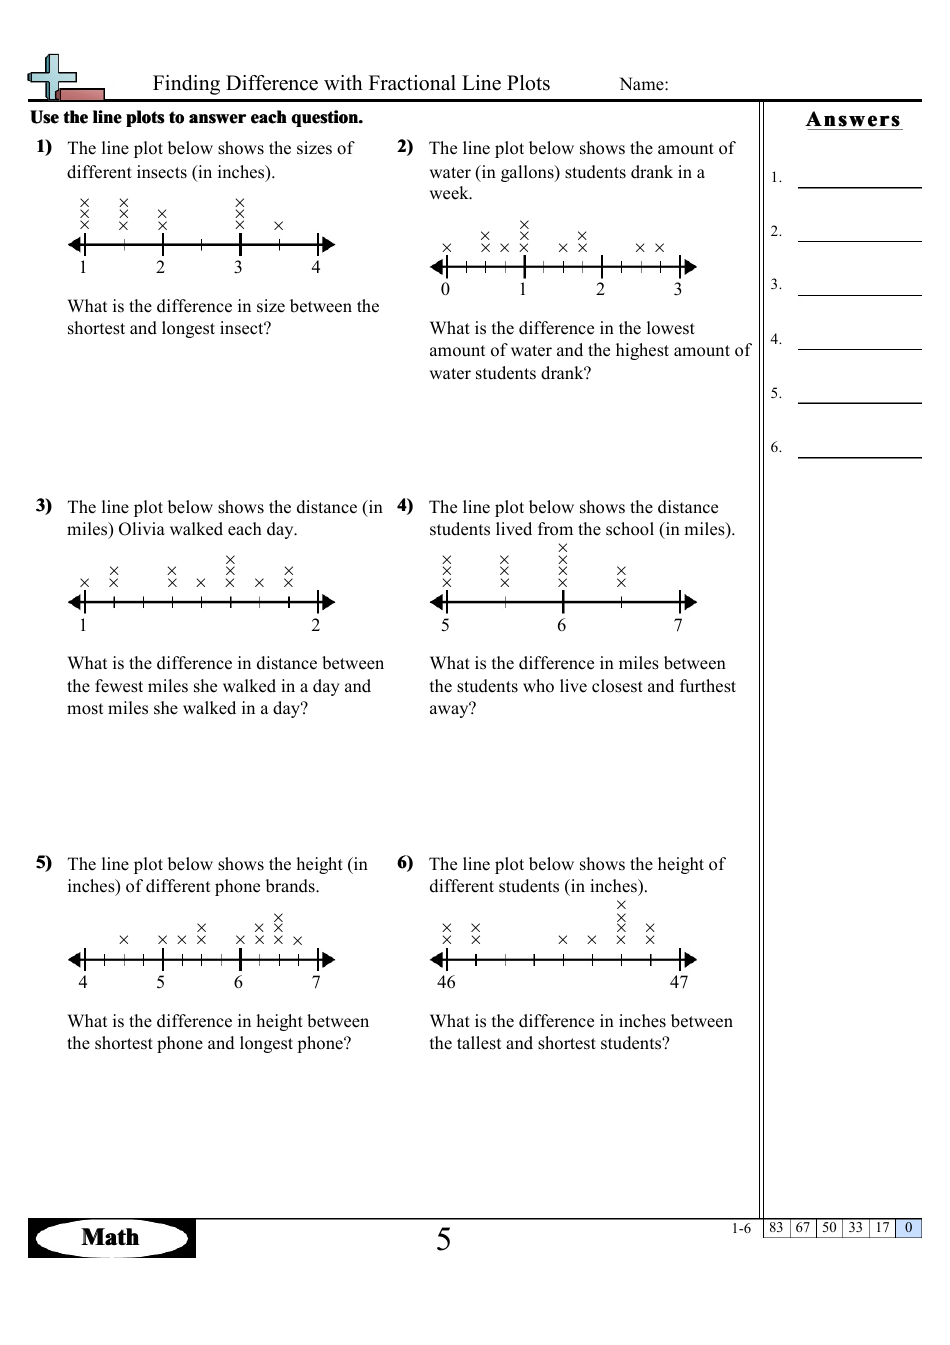
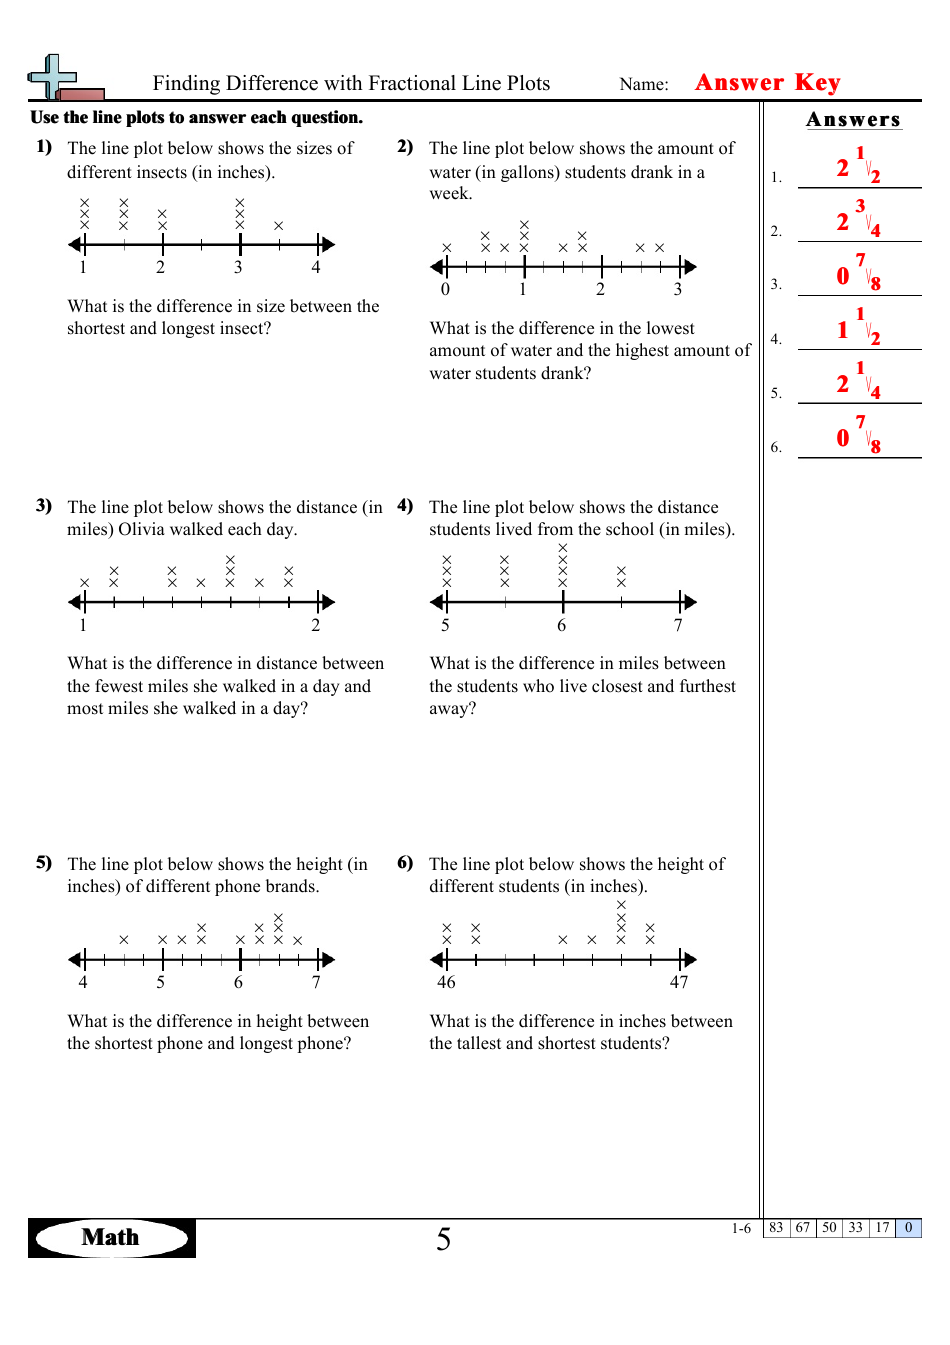
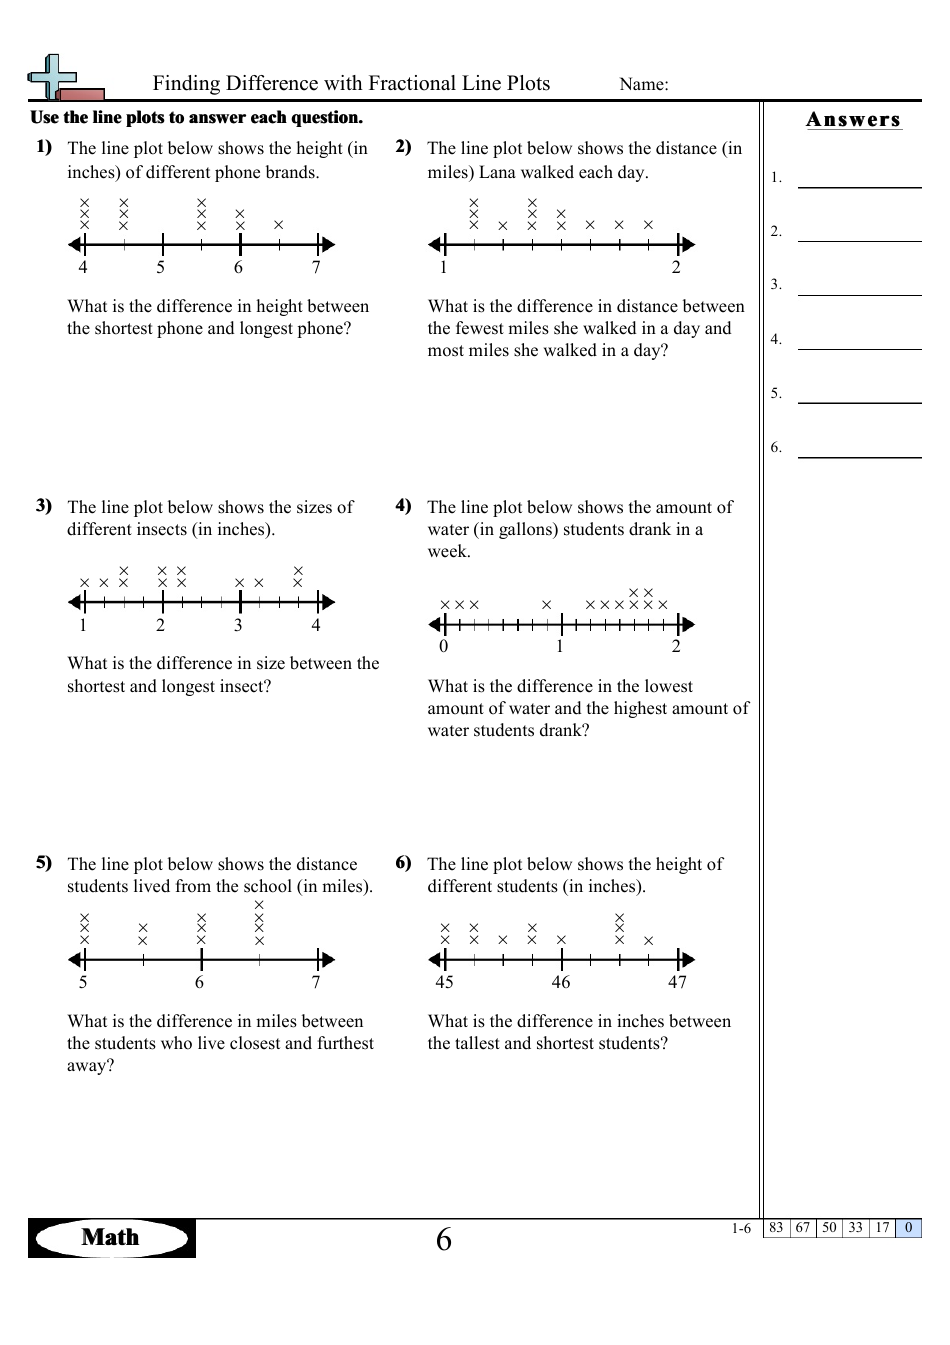
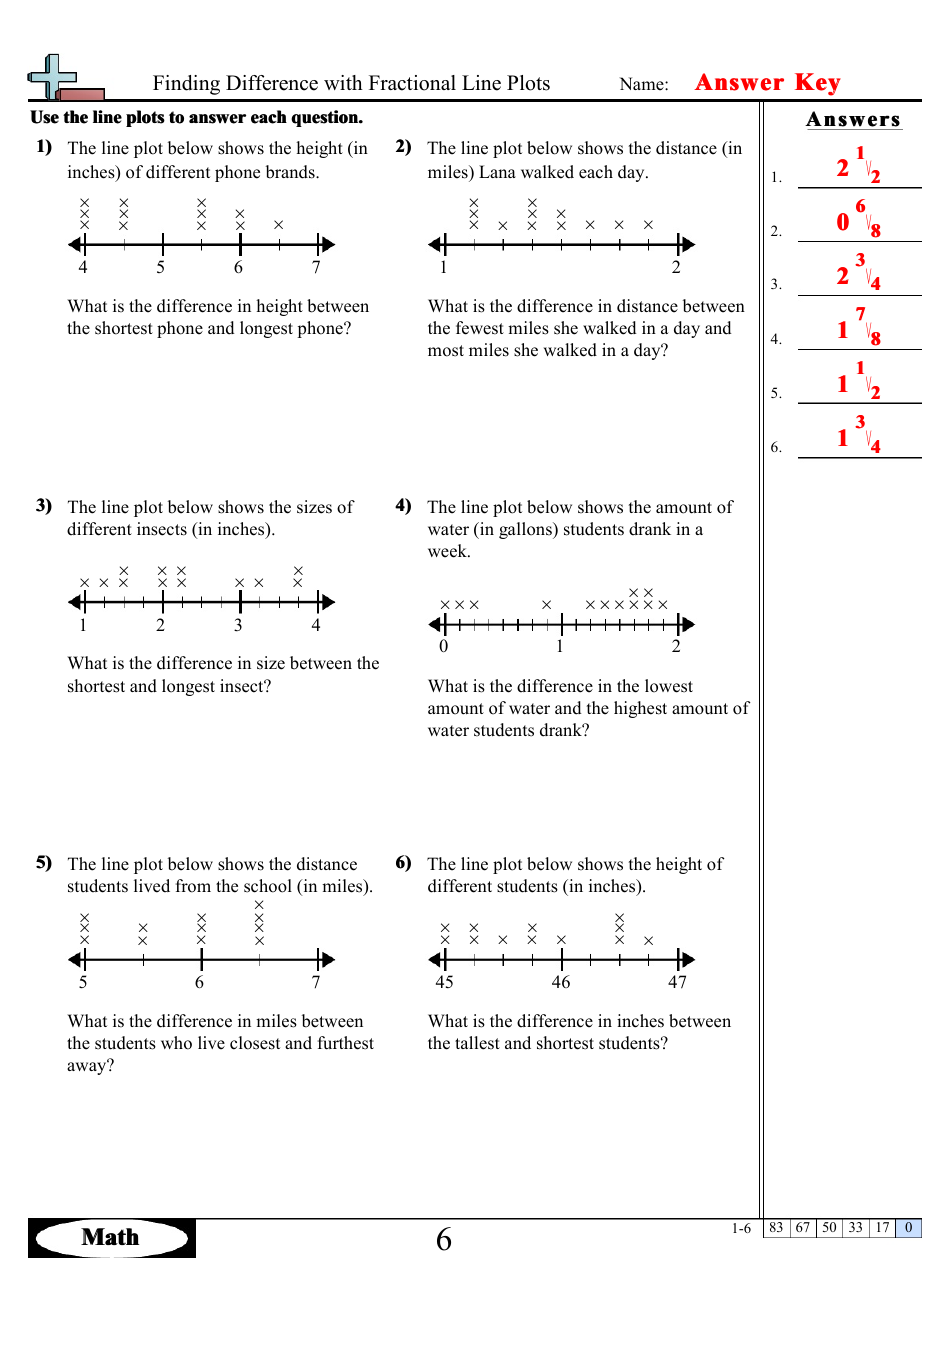
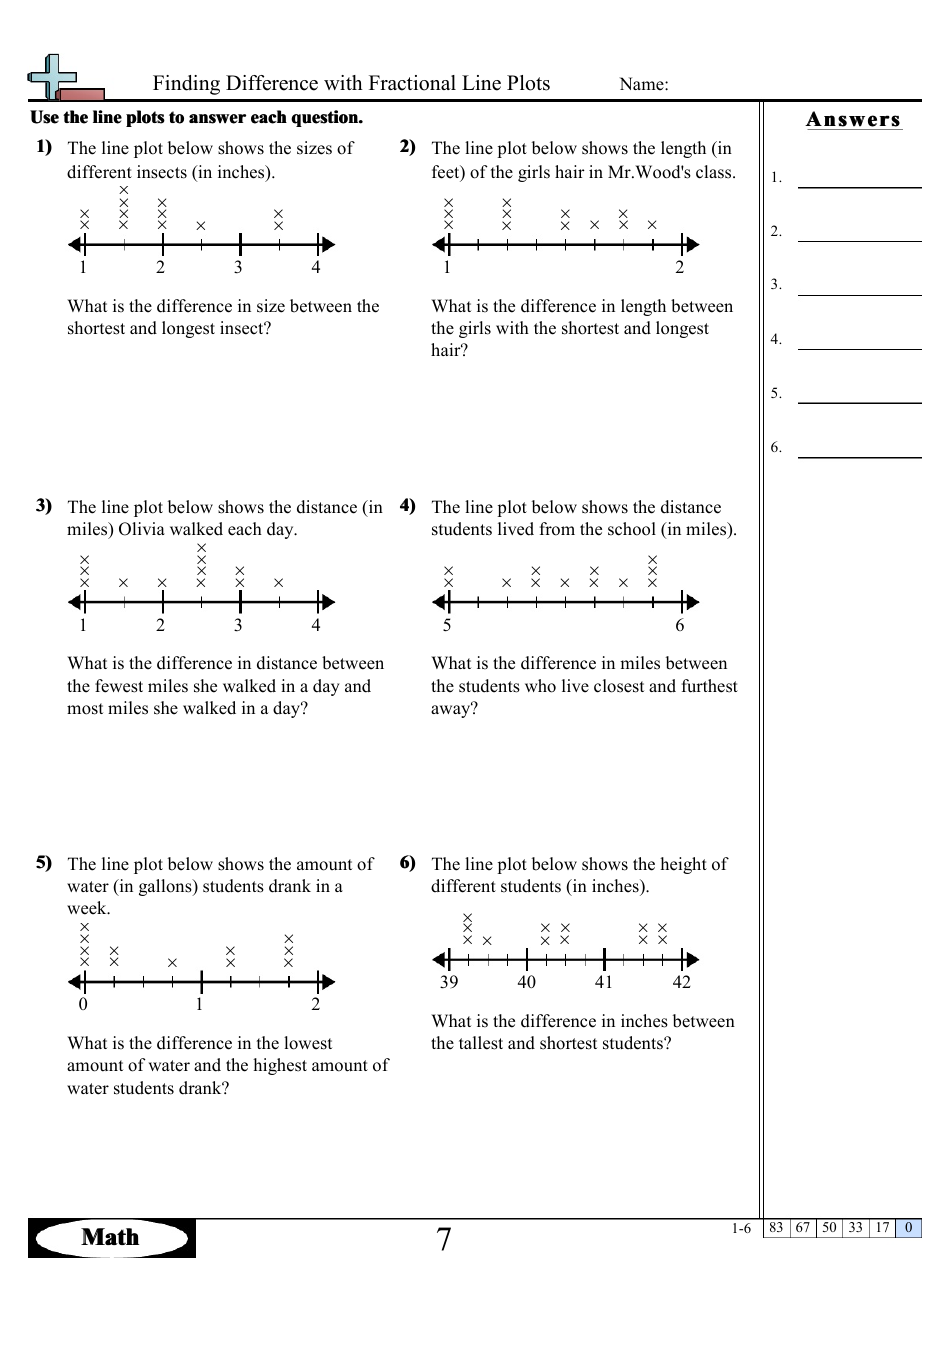
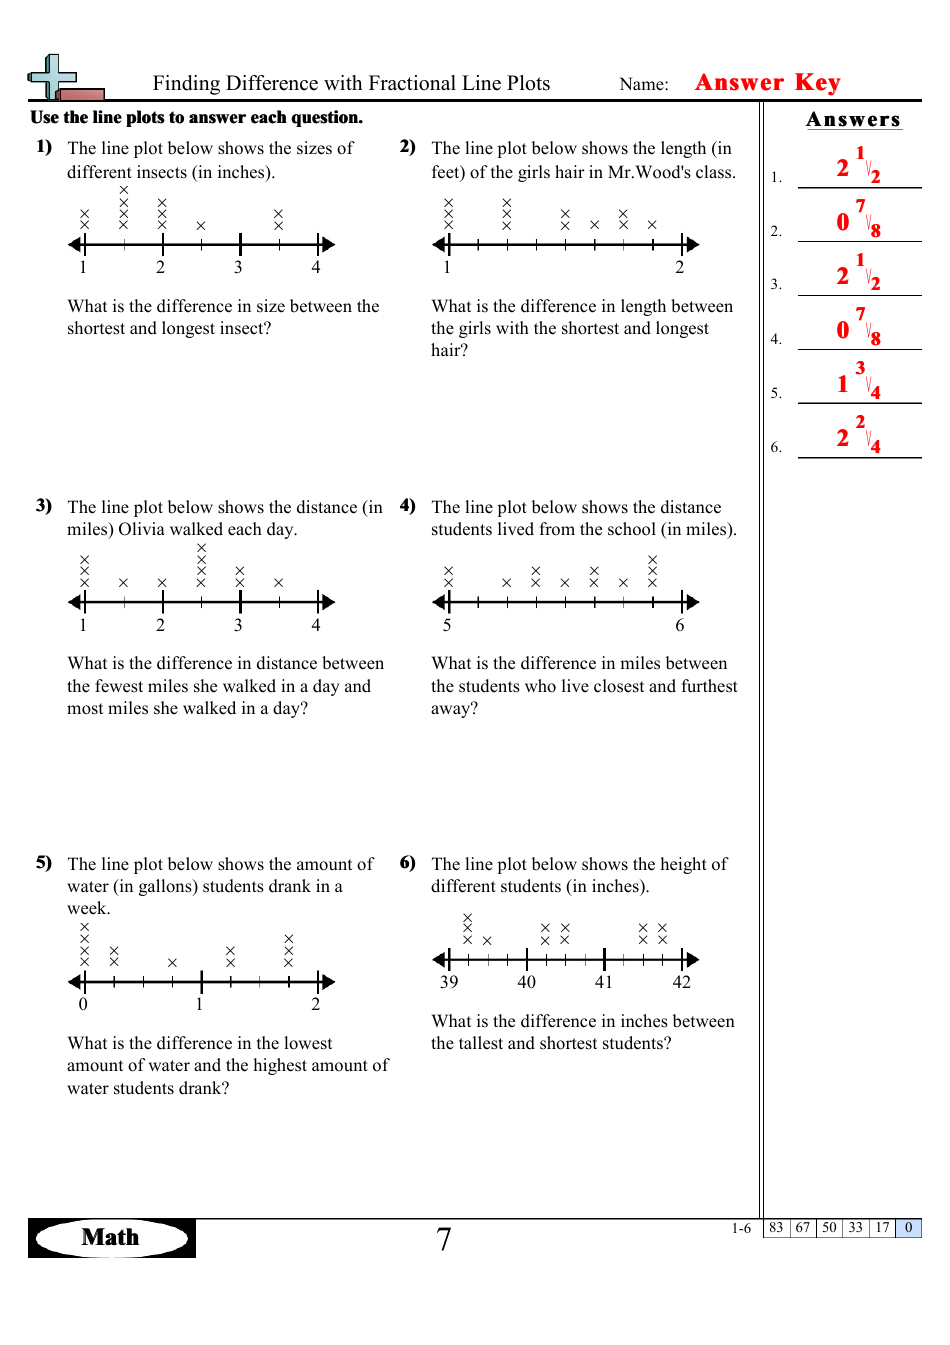
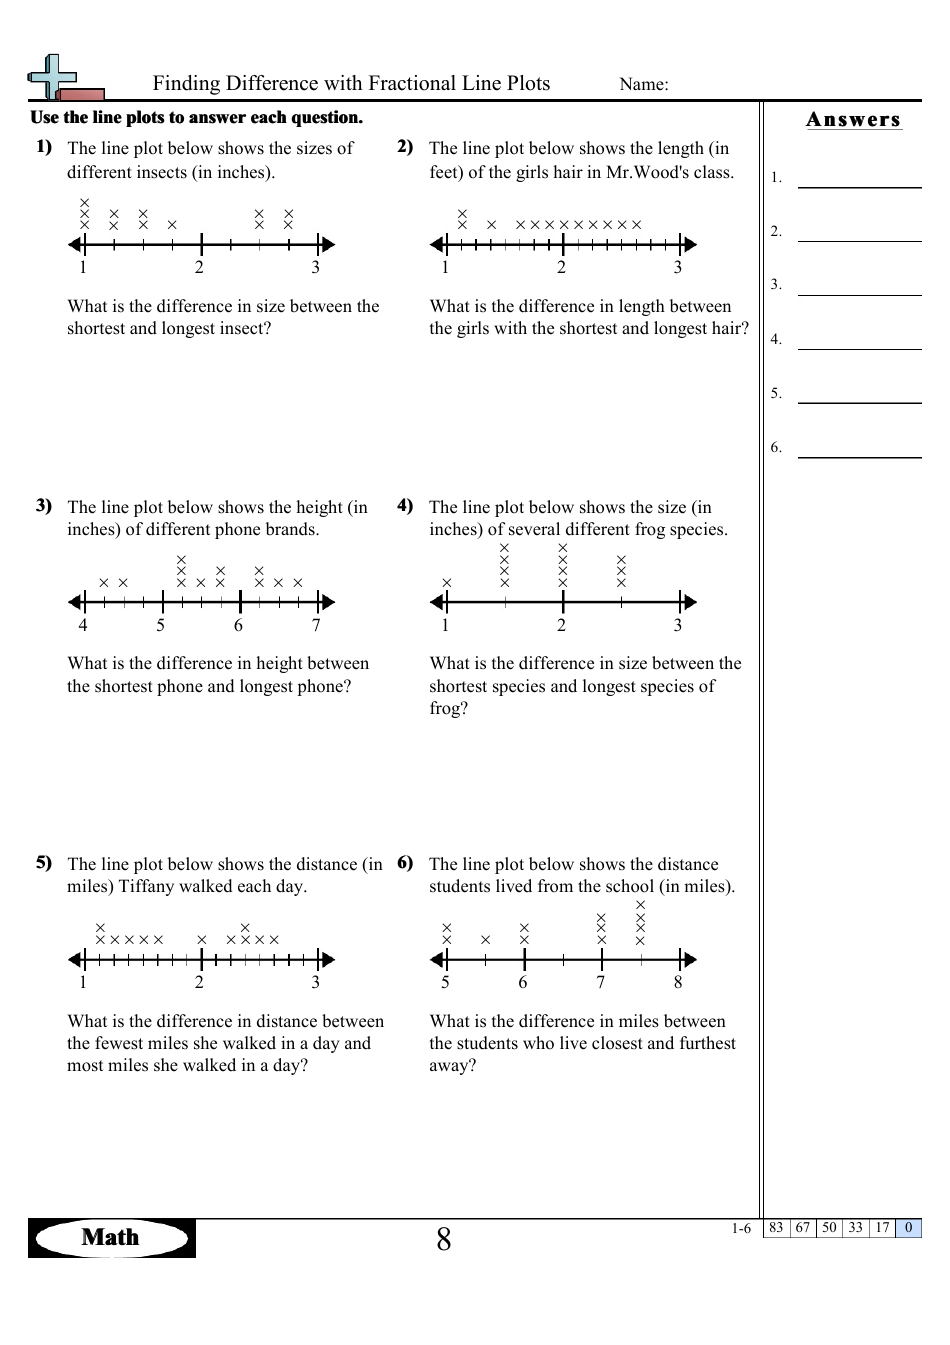
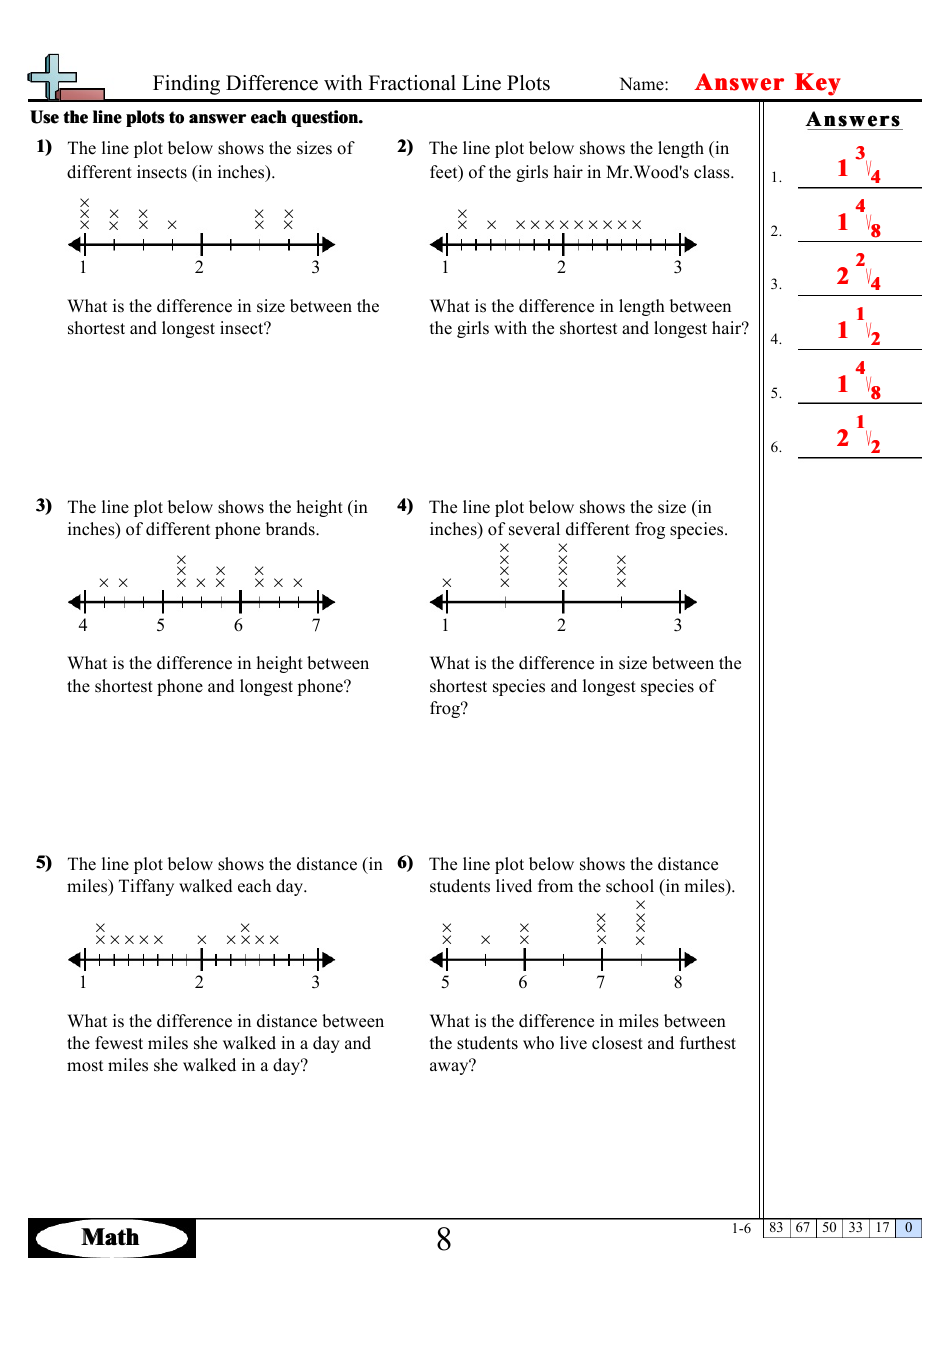
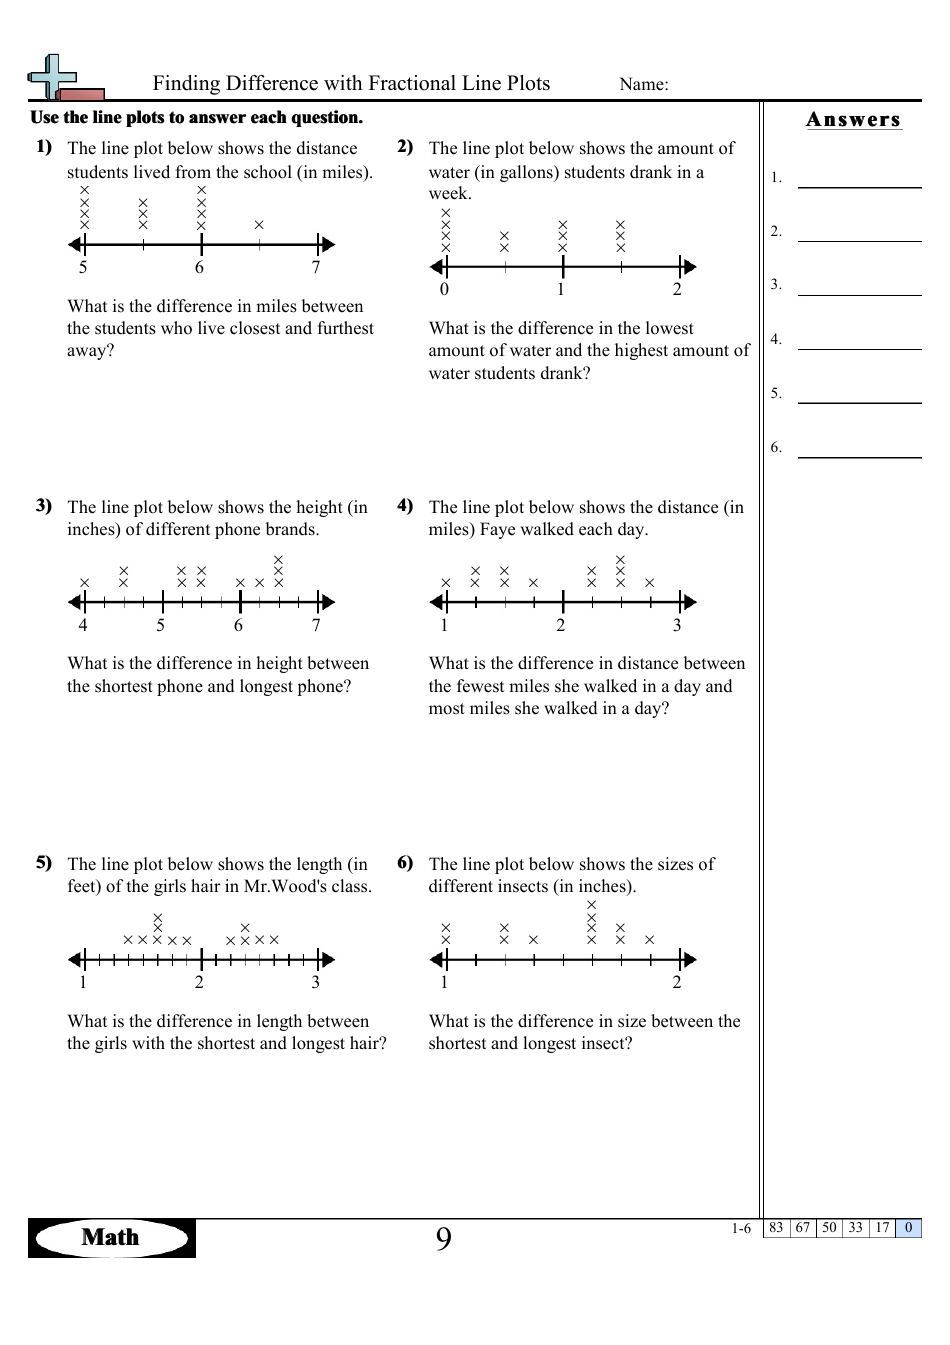
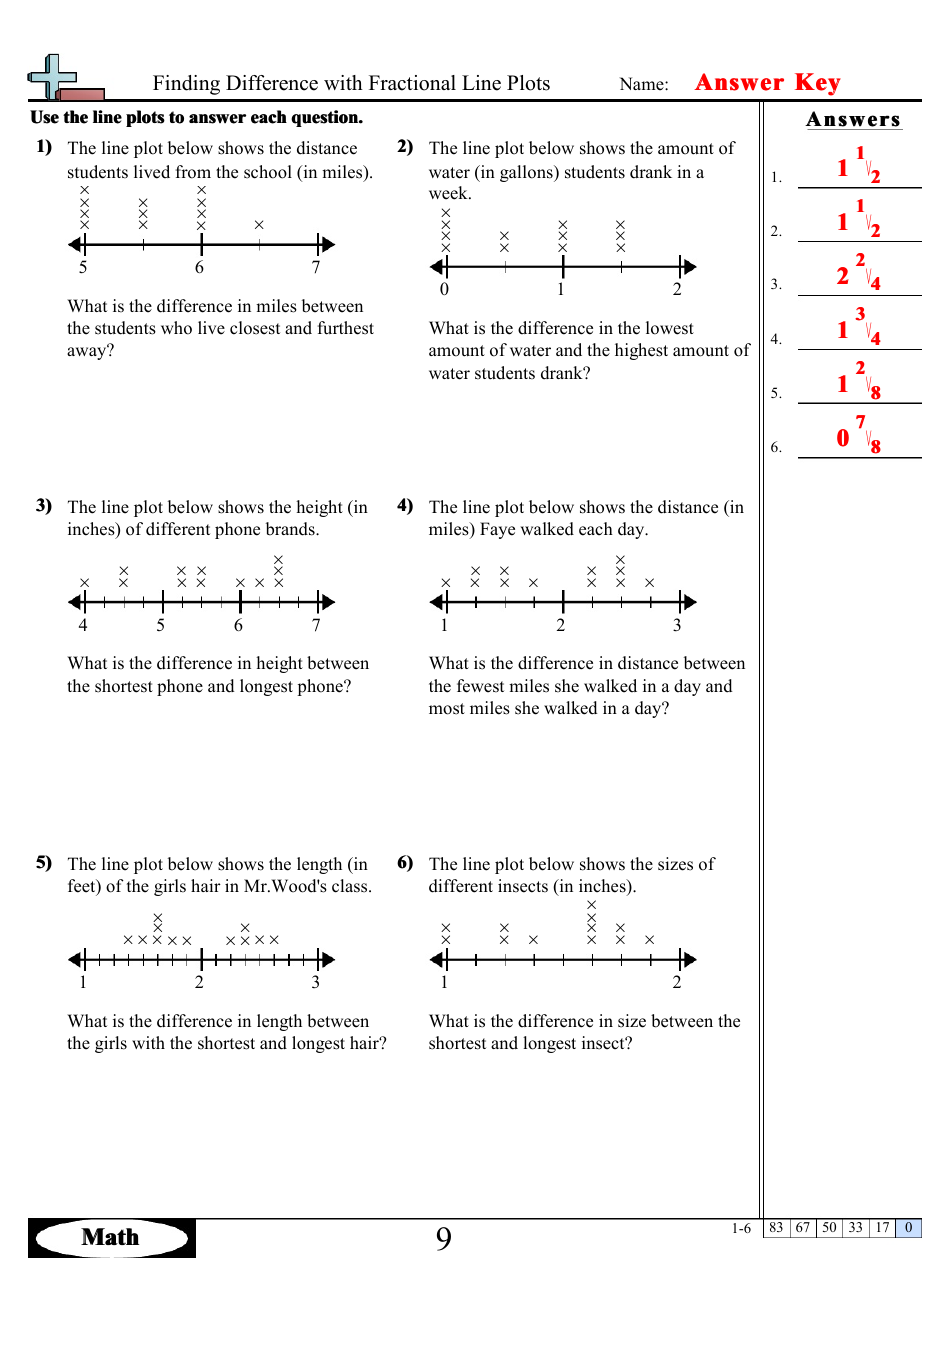
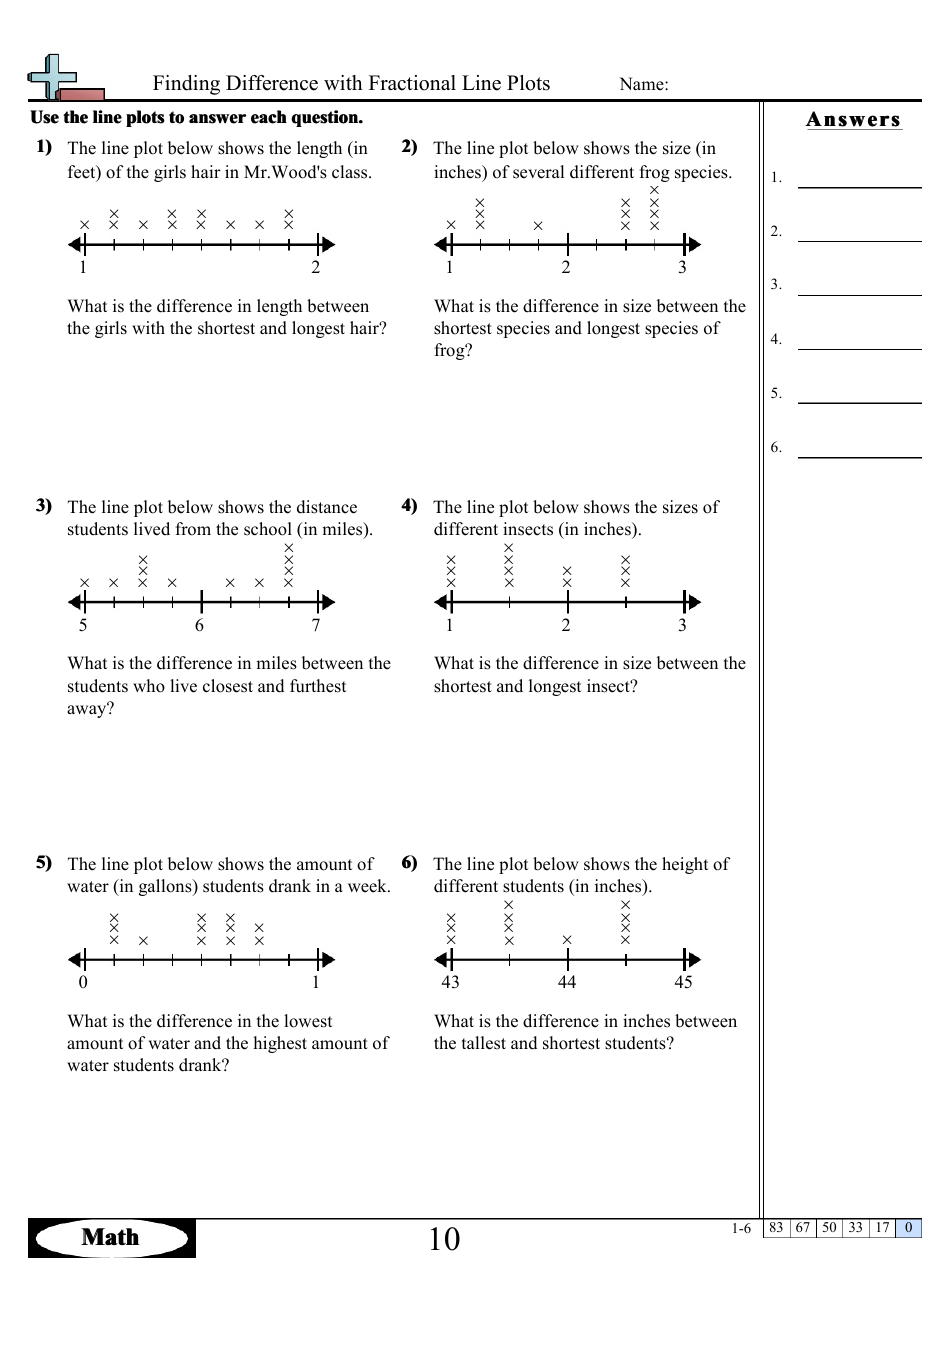
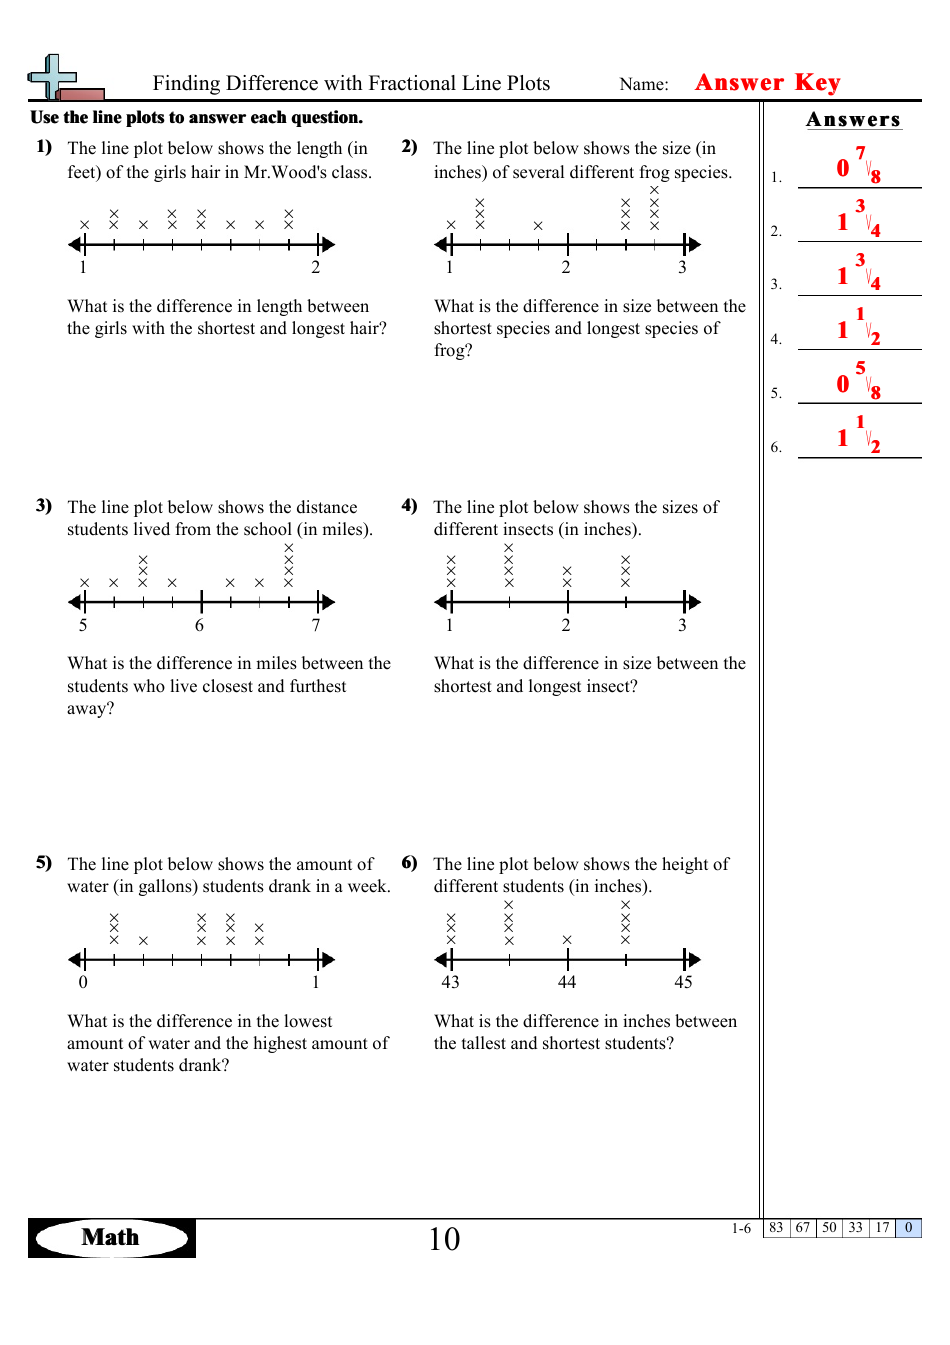
Finding Difference with Fractional Line Plots Worksheets with Answers is a tool used for practicing and reinforcing the concept of finding the difference between two fractions on a line plot. These worksheets provide a visual representation of fractions on a number line, allowing students to determine the difference between two given fractions. The accompanying answer key helps students check their work and understand the correct solution. By using these worksheets, students can develop their skills in comparing and finding the difference between fractional values.
The filing of "Finding Difference with Fractional Line Plots Worksheets with Answers" typically falls within the responsibility of educators, teachers, or parents who are supervising the educational activities of students. Worksheets are commonly used in classrooms or for home assignments to help students practice and improve their skills in understanding and interpreting line plots with fractional values.
FAQ
Q: What are fractional line plots?
A: Fractional line plots are graphical representations that use a number line to display data in fractions. They help to visually represent fractional values and their frequency or occurrence.
Q: How are fractional line plots different from regular line plots?
A: Regular line plots display whole numbers on a number line, while fractional line plots represent data using fractions. Instead of counting occurrences of whole numbers, fractional line plots show the frequency of fractional values.
Q: What do the marks on a fractional line plot represent?
A: The marks on a fractional line plot represent the data values or fractions being measured. Each mark represents the occurrence or frequency of that particular fraction within the data set.
Q: How can fractional line plots be useful?
A: Fractional line plots provide a visual representation of data in fractions, which can be helpful for understanding patterns, comparing fractions, and analyzing data sets with fractional values. They can also be used to find the range, mode, and median of the data.
Q: How do you read a fractional line plot?
A: To read a fractional line plot, look at the number line and locate the fractional marks. The height or length of each mark represents the frequency or occurrence of the corresponding fraction in the data set.
