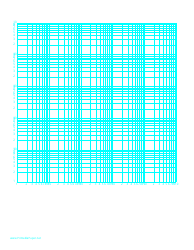
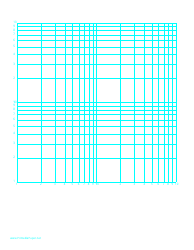
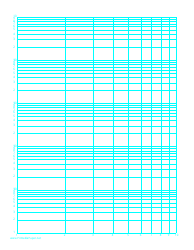
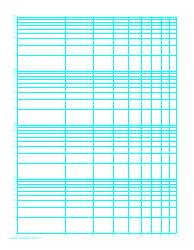
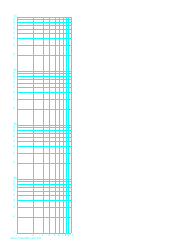
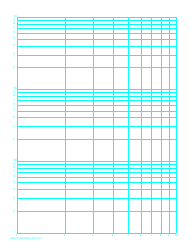
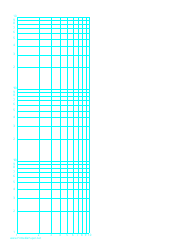
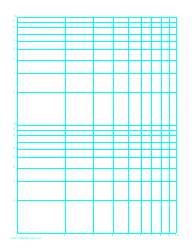
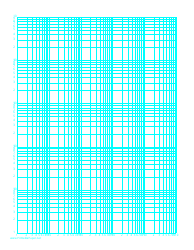
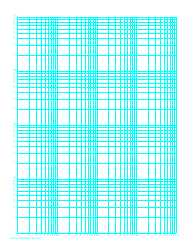
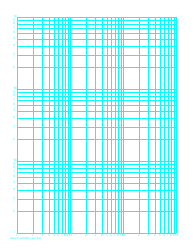
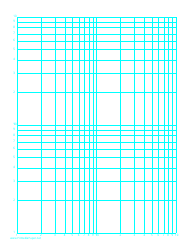
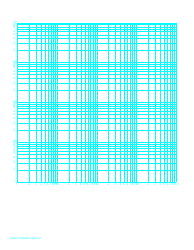
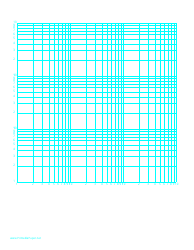
Log-Log Paper With Logarithmic Horizontal Axis (One Decade) and Logarithmic Vertical Axis (One Decade) With Equal Scales Template - Long
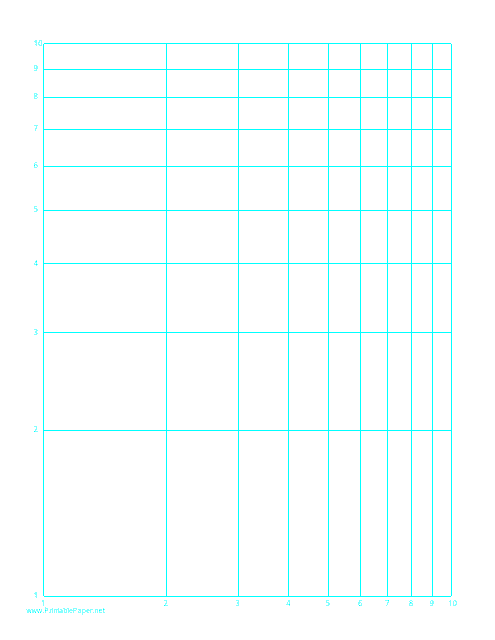
The Log-Log Paper with Logarithmic Horizontal Axis (One Decade) and Logarithmic Vertical Axis (One Decade) with Equal Scales Template - Long is a specialized graph paper that is used typically in scientific and engineering applications.
This special graph paper employs a logarithmic scale in both the horizontal and vertical directions, which means that both axes are partitioned not in a linear (standard) fashion, but in orders of magnitude.
With equal scales, this means that the spacing between different orders of magnitude is the same on both the horizontal and vertical axes.
The primary use of this graph paper is for depicting data that covers a very large range or when such data follows an exponential or power-law distribution. This can also be helpful in showing multiplicative factors, seen often in areas like Physics, Engineering, and Economics.
The 'long' aspect might refer to the size of the paper or grid itself, providing plenty of space for capturing detailed data points across large ranges of values.
Such paper is available for free download from user-friendly sources or specialized science, mathematics and engineering outlets. Remember, however, this type of graph may be more complex to read and understand compared to the standard linear graphing methods due to its logarithmic scale. It is best utilized by those with knowledge in the specific fields.
FAQ
Q: What is Log-Log Paper?
A: Log-Log Paper is a kind of semi-log paper with logarithmic scales on both the horizontal and vertical axes. It is frequently used in science and engineering for visualizing data that cover a large range.
Q: How is Log-Log Paper used?
A: Log-Log Paper is used by plotting data on the logarithmic scales. It can represent exponential growth or decline, power laws, and some types of noise. It helps to visualize data that change over a wide range.
Q: What does 'one decade' in Log-Log Paper mean?
A: In Log-Log Paper, 'one decade' refers to a tenfold (or 10x) increase. A graph that spans 'one decade' shows a range from 1 to 10, or from 10 to 100, etc.
Q: What are ‘equal scales’ on a Log-Log Paper?
A: Equal scales on a Log-Log Paper mean that the same logarithmic increase on the horizontal axis corresponds to the same logarithmic increase on the vertical axis.
Q: What are some benefits of using Log-Log Paper?
A: Log-Log Paper allows for displaying and interpreting data over a wide range. It helps in recognizing and demonstrating patterns that might not be apparent in linear scale. It can also linearize certain types of exponential or power law data.
Q: What fields use Log-Log Paper?
A: Log-Log Paper is often used in fields such as physics, engineering, biology, economics, and earth science to represent data that cover a wide range.
