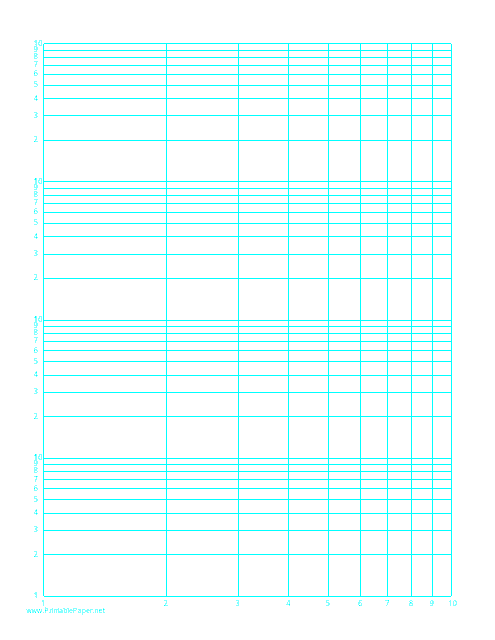
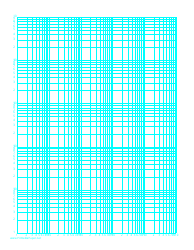
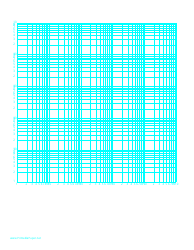
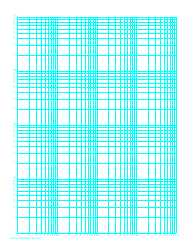
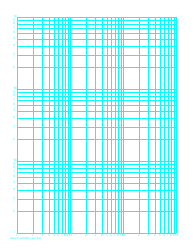
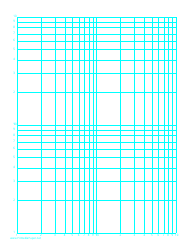
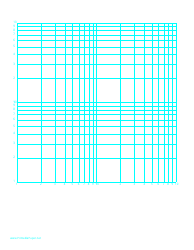
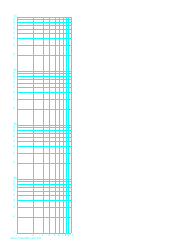
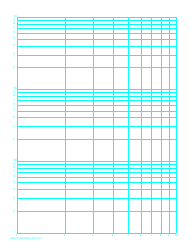
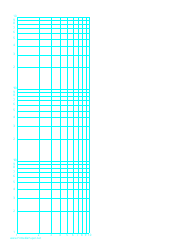
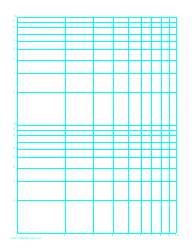
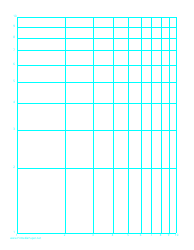
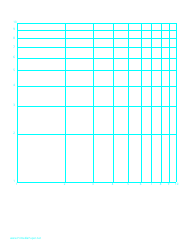
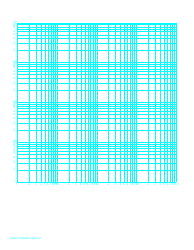
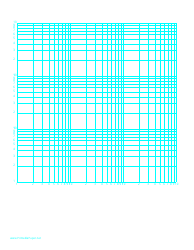
Log-Log Paper With Logarithmic Horizontal Axis (One Decade) and Logarithmic Vertical Axis (Four Decades) on Letter-Sized Paper Template
The Log-Log Paper with Logarithmic Horizontal Axis (One Decade) and Logarithmic Vertical Axis (Four Decades) on Letter-Sized Paper Template is a specialized graph paper intended for use in scientific and engineering fields. This type of log-log paper is used when the data spans several orders of magnitude and both variables are expected to display a logarithmic relation.
In practical terms, it's often used to plot data that changes exponentially, or for data that's been collected over a large time frame. This log-log scale makes it easier to visualize and communicate the trends in data that might not be as evident in a linear scale. Examples include earthquake data (Richter scale), sound (decibels), and light intensity. Such data, when graphed on this type of paper, usually result in a straight line, making it easier to predict and understand trends.
FAQ
Q: What is a Log-Log Paper?
A: A Log-Log Paper is a type of graph paper that uses logarithmic scales on both the horizontal and vertical axes. It's used for graphing primarily when the data covers a large range of values for both axes.
Q: What does the 'One Decade' in Horizontal Axis mean?
A: In a Log-Log Paper, 'One Decade' in the horizontal axis means that each unit of increase along that axis represents a ten-fold (or an order of magnitude) increase.
Q: What does 'Four Decades' on the Vertical Axis imply?
A: 'Four Decades' on the vertical axis means that the range of values represented on that axis spans four orders of magnitude. For example, it might extend from 1 to 10,000.
Q: What is the use of a Letter-Sized Paper template?
A: A Letter-Sized Paper template is a standard paper size template. In the United States and Canada, letter size paper is exactly 8.5 by 11 inches in size. It defines the format and layout of the log-log graph.
Q: What does a Logarithmic scale indicate in a Log-Log Paper?
A: A Logarithmic scale on a Log-Log Paper indicates that each tick mark on the axis is the previous tick mark multiplied by a certain value, rather than just added or subtracted. This allows for a wide range of values to be displayed without the graph becoming too large or information being lost.
