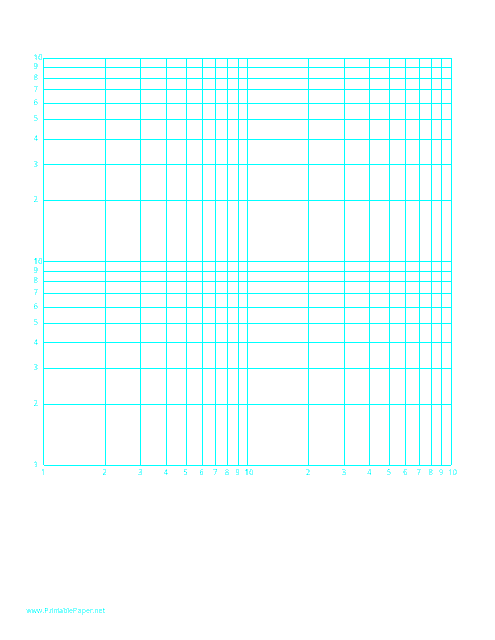
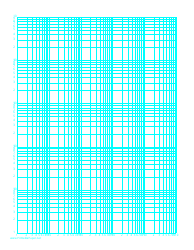
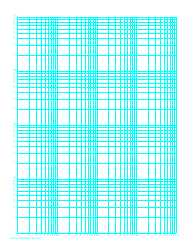
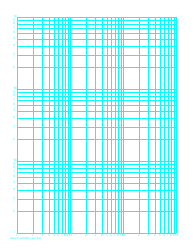
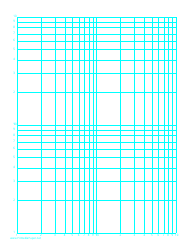
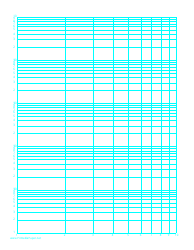
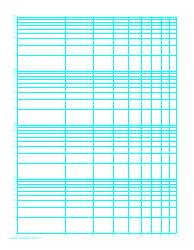
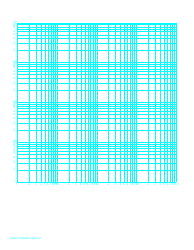
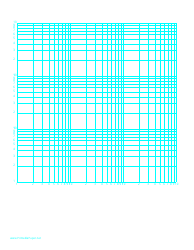
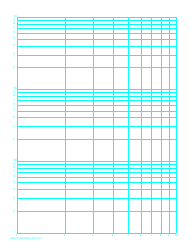
Log-Log Paper With Logarithmic Horizontal Axis (Two Decades) and Logarithmic Vertical Axis (Two Decades) With Equal Scales on Letter-Sized Paper
Log-Log paper with a logarithmic horizontal axis (two decades) and a logarithmic vertical axis (two decades) with equal scales on letter-sized paper is typically used for the graphical representation of mathematical functions or physical phenomena that exhibit exponential behavior. This type of paper allows the graphing of exponents and logarithmic scales efficiently.
Both the x and y axes are divided into logarithmic scales which allow you to plot data that spans multiple orders of magnitude. Each axis often spans two decades, meaning the values on the axis range over two powers of ten. This type of graph paper is particularly useful in fields like engineering, physics, and economics, where exponential growth or decay is often observed.
For example, engineering and physics use it to graph phenomena (e.g., radioactive decay or population growth) that increase or decrease exponentially. Economists can use it to graph economic data over time, such as GDP or stock market indices, that exhibit exponential trends. Essentially, the use of such paper simplifies the process of graphing and interpreting exponential data.
The Log-Log Paper with Logarithmic Horizontal Axis (Two Decades) and Logarithmic Vertical Axis (Two Decades) with Equal Scales on Letter-Sized Paper doesn't apply to a specific entity or body who files it universally. This type of graph paper is typically used by mathematicians, engineers, scientists, and students while making calculations, performing data analysis, graphing complex data, etc. Exact usage may vary largely from one individual to another based on their specific needs.
FAQ
Q: What is Log-Log Paper with Logarithmic scale?
A: Log-Log Paper is a type of graph paper which features axes that increase in a logarithmic scale. This means each consecutive value is multiplied by a constant factor, allowing the graph of exponential functions to appear as straight lines rather than curves.
Q: What does 'Two Decades' mean in Log-Log Paper?
A: In the context of logarithmic scales, a 'decade' is a 10-times or 10-fold increase. So a Log-Log Paper with 'Two Decades' has an axis that scales from 1 to 100.
Q: How is Equal Scales significant in Log-Log paper?
A: Equal Scales on a Log-Log Paper indicates that the horizontal axis and the vertical axis will increase at the same rate, meaning the angle of a plotted line will accurately represent the relation between the axes' values.
Q: What is the size of Letter-sized paper?
A: Letter-sized Paper in the United States and Canada typically measures 8.5 inches by 11 inches.
Q: In what fields is Log-Log paper typically used?
A: Log-Log paper is frequently used in scientific fields, particularly in physics, engineering, and mathematics. It's used to plot data that covers a large range of values in a compact and interpretable way.
Q: How do you read a graph on Log-Log paper?
A: In a graph on Log-Log Paper, the location of a point corresponds to the logarithms of its coordinates. Thus, an exponential relationship between the graphed quantities appears as a straight line, making it easier to analyze.
