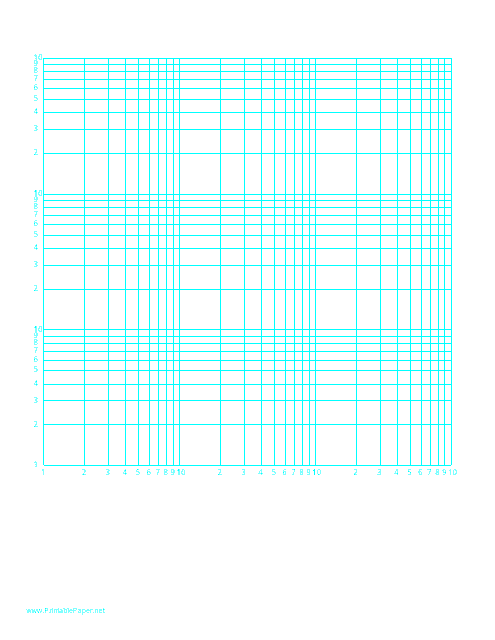
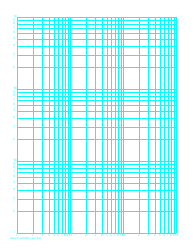
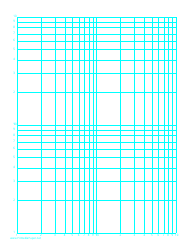
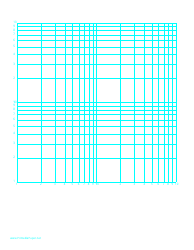
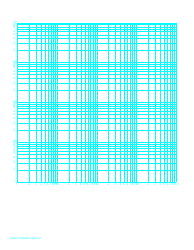
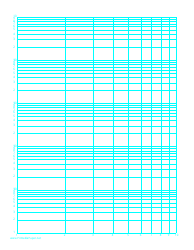
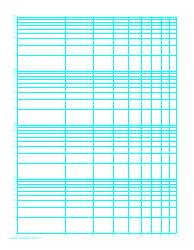
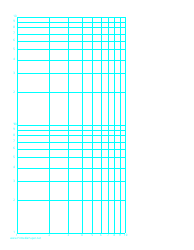
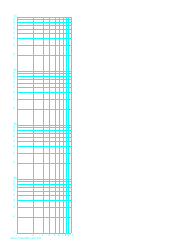
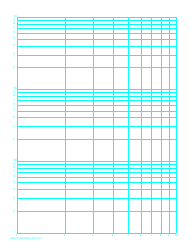
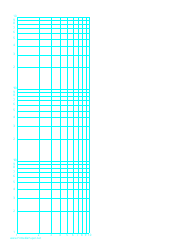
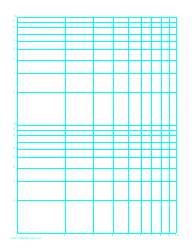
Log-Log Paper With Logarithmic Horizontal Axis (Three Decades) and Logarithmic Vertical Axis (Three Decades)
Log-Log Paper with Logarithmic Horizontal Axis (Three Decades) and Logarithmic Vertical Axis (Three Decades) is typically used for graphical representation of mathematical data showing rates of change for certain variables. It is often used in fields such as engineering, physics, or math.
For example, when you want to plot data in which the values vary greatly (small and large values), the scale of a standard graph paper can be limiting. Log-Log paper allows you to plot three orders of magnitude (10^1, 10^2, 10^3) or decades on both the X and Y axis—meaning you can plot very large or small values all on the same graph.
In practical applications, Log-Log plots are commonly used in presenting scientific data, in particular data that follows a power law, for instance the frequency of words in most languages, populations of cities, income rankings, or sizes of earthquakes or meteorites.
They are also often used in signal processing applications; biological growth, decay, or survival rates; or other instances where a multiplicative growth pattern is assumed.
The Log-Log Paper With Logarithmic Horizontal Axis (Three Decades) and Logarithmic Vertical Axis (Three Decades) is not a document that is "filed" by a specific entity or agency. Instead, it is a type of graph paper that is commonly used in scientific and engineering fields to plot variables that cover a wide range of values. Therefore, it's not directly associated with filing or document management by any country or organization.
FAQ
Q: What is Log-Log paper?
A: Log-Log paper or logarithmic graph paper has a logarithmic scale on both the horizontal and vertical axes. It's used to represent data that cover a large range
Q: What is meant by 'Three Decades' in Log-Log paper?
A: In context of Log-Log paper, 'Three Decades' refers to a range of values that increase by a factor of 10. So, the first decade might be 1-10, the second 10-100, and the third 100-1000.
Q: What are the uses of Log-Log paper?
A: Log-Log paper is used in fields such as engineering, physics, and mathematics for scalability, to detect exponential trends, and displaying data that rapidly increases or decreases.
Q: When would you use Log-Log paper?
A: One would use Log-Log paper when dealing with exponential or logarithmic data, or when wanting to show percentage change or multiplicative factors.
Q: Can Log-Log paper be used to plot any data?
A: While Log-Log paper can technically be used to plot any data, it's specifically useful for data that follows logarithmic or exponential trends.
Q: Who invented the Log-Log paper?
A: The concept of Logarithmic paper, which includes Log-Log paper, was first proposed by Dr. John Napier, the inventor of logarithms.
Q: What are some alternatives to Log-Log paper?
A: Alternatives to Log-Log paper include Semi-Log paper (where only one axis is logarithmic) and regular graph paper. Another alternative is using digital graphing tools and software which can mimic the functionality of Log-Log paper.
