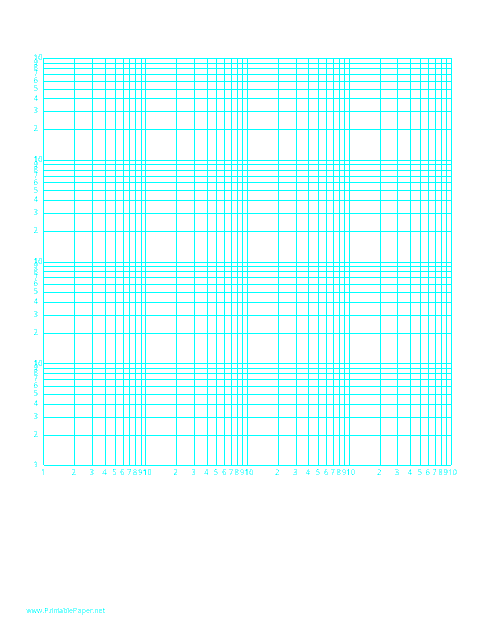
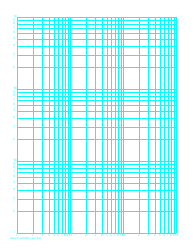
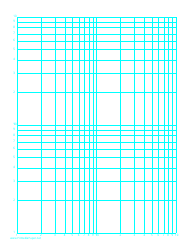
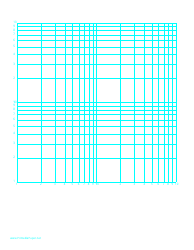
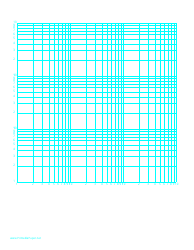
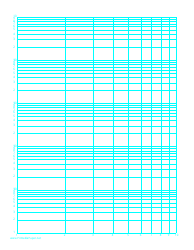
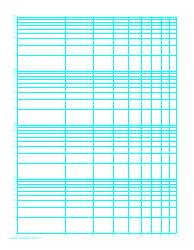
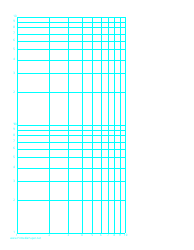
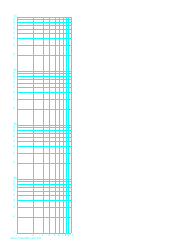
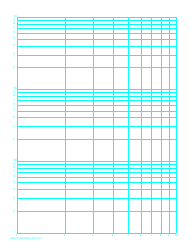
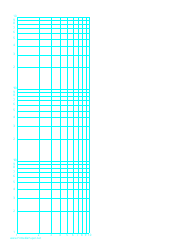
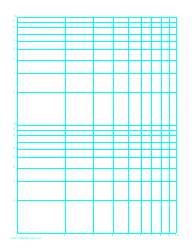
Log-Log Paper With Logarithmic Horizontal Axis (Four Decades) and Logarithmic Vertical Axis (Four Decades)
Log-Log Paper with Logarithmic Horizontal Axis (Four Decades) and Logarithmic Vertical Axis (Four Decades) is typically used in mathematical and engineering fields. It is paper that has both the x and y axes marked in logarithmic scale, and it is primarily used for graphing variables that cover a large range of values and exhibit exponential or logarithmic growth or decay.
The four decades aspect means that each axis of the log-log paper is marked in such a way to represent four orders of magnitude. One of the major uses of this type of paper is in the creation of semi-log plots or log-log plots, which can graphically depict exponential or logarithmic data, respectively. These plots are often used in understanding and interpreting trends in data, such as population growth, radioactive decay, or the growth of a bacterial culture, for example.
The properties of this specialized graphing paper allow the user to show a single curve, rather than multiple ones, simplifying data presentation and interpretation. This is particularly important when dealing with large data sets, or measurements with a great range of values. So, this tool is ideal for scientists, engineers, researchers, and students who need to handle complex sets of data and draw meaningful conclusions.
The Log-Log Paper With Logarithmic Horizontal Axis (Four Decades) and Logarithmic Vertical Axis (Four Decades) isn't typically a document that is filed with a specific organization or institution like government incidents or patent applications. It is a type of graph paper used in various fields such as engineering, physics, mathematics, and economics for data representation that exhibits exponential or logarithmic relationships. Individuals, researchers, students, or professionals who are conducting relevant studies or projects would utilize this kind of paper. Hence, it is not a standard document that is 'filed' by a particular person or entity.
FAQ
Q: What is a log-log paper?
A: Log-log paper is a type of graph paper that allows for the plotting and analysis of data that follow exponential trends. The logarithmic scales on both the horizontal and vertical axes allow for the straight-line representation of exponential growth or decay.
Q: What does four decades mean on a log-log paper?
A: In the context of a log-log graph paper, 'four decades' means that the paper is marked such that it accommodates a range of values that span four orders of magnitude or powers of ten on both the horizontal and vertical axes. For example, the scale might go from 0.1 to 10000.
Q: What is the use of a Log-Log paper with four decades on both axes?
A: A four-decade Log-Log paper is often used for graphing and studying functions or data sets that exhibit exponential growth or decay over a wide range. Areas this might be used in include economics, sciences and engineering.
Q: How is a log-log plot different from a regular plot?
A: A log-log plot is different from a regular plot because both the x and y-axes are logarithmic, as opposed to being linear. This enables the plot to display a much wider range of values, and to represent exponential relationships as straight lines.
