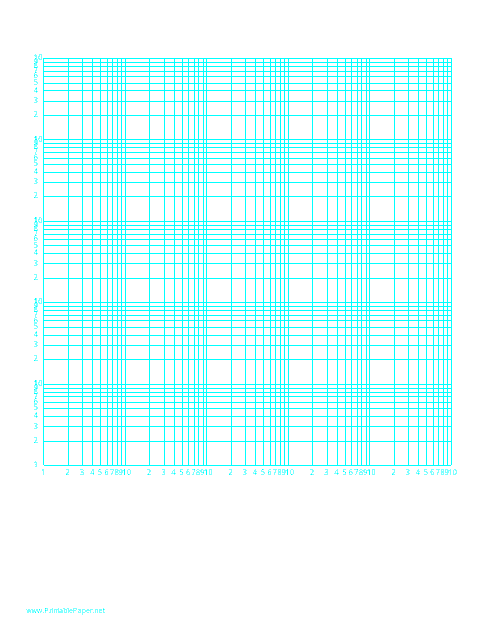
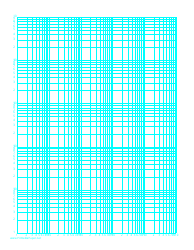
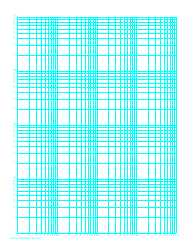
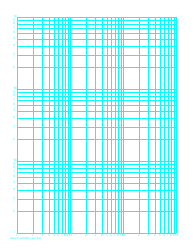
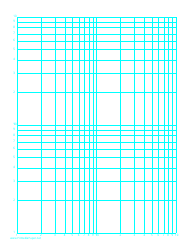
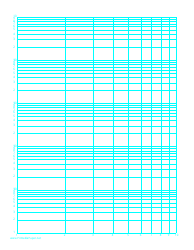
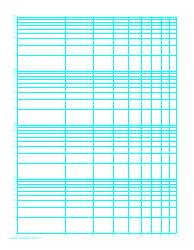
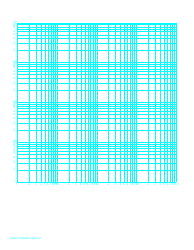
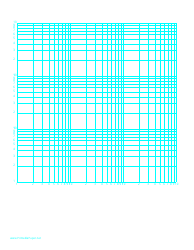
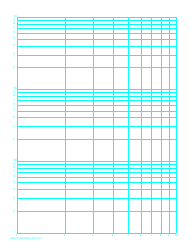
Log-Log Paper With Logarithmic Horizontal Axis (Five Decades) and Logarithmic Vertical Axis (Five Decades) With Equal Scales on Letter-Sized Paper
Log-Log Paper with a Logarithmic Horizontal Axis (Five Decades) and Logarithmic Vertical Axis (Five Decades) with Equal Scales on Letter-Sized Paper is primarily used for graphing and analyzing data that covers a large range of values. In particular, it's often used in fields like engineering, physics, and mathematics for visualizing data or mathematical relationships where both the X and Y axes span several orders of magnitude. Since this type of graph paper employs a logarithmic scale, it allows for the detailed representation of data trends that might otherwise appear cramped or minuscule on a standard linear scale graph. It's a tool that can provide a clear view of exponential or power law data. When dealing with proportions and ratios, logarithmic graphing can be more useful and intuitive than linear graphing.
The Log-Log Paper With Logarithmic Horizontal Axis (Five Decades) and Logarithmic Vertical Axis (Five Decades) With Equal Scales on Letter-Sized Paper is not a document that is specifically filed by any group, country or individual. It's essentially a type of graph paper that is used in several academic and scientific fields, especially in cases where the data covers a large range of values. This type of graph paper is freely available for use and does not typically require any sort of official filing when used.
FAQ
Q: What is a log-log paper with logarithmic horizontal and vertical axes?
A: A log-log paper, or semi-logarithmic paper, is graphing paper that has both the horizontal and vertical axes scaled logarithmically. It allows for data with a wide range to be plotted on the same graph, especially when both the x and y variables are changing exponentially.
Q: What does 'five decades' mean in the context of log-log paper?
A: In the context of log-log paper, 'five decades' refers to the scope of the chart. A decade is a factor of ten, so five decades signifies that each axis covers a range of 100,000 (10^5).
Q: How is equal scales significant on a log-log paper?
A: When both axes on a log-log paper have equal scales, it means that a given distance on the graph represents the same proportional increase, no matter where it is located on the scale. This can make visualizing exponential growth or decay easier.
Q: What is the purpose of using letter-sized log-log paper?
A: Letter-sized log-log paper is typically used for convenience, as it corresponds to the standard paper size in the United States and Canada, i.e. 8.5 x 11 inches. This makes it easier to print, store, and use.
Q: Why do you need log-log paper?
A: Log-log paper is used in various fields such as physics, engineering, and economics to graph data that covers a large range of values. It's particularly useful for representing functions and datasets that exhibit exponential growth or decay.
