Star Chart / Diagram
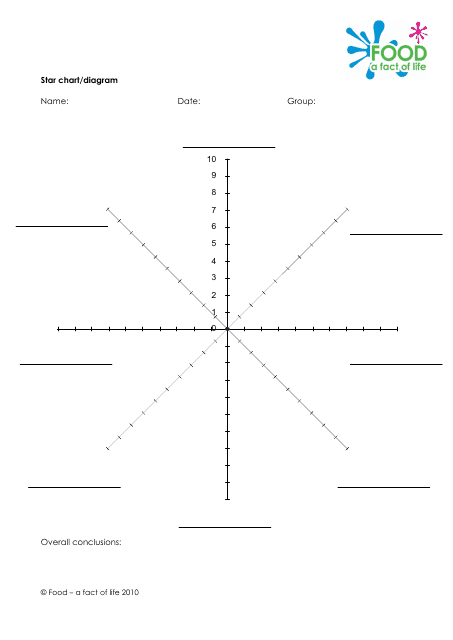
A Star Chart or Diagram is a graphical tool used by astronomers and stargazers to map and locate different celestial objects in the night sky. It represents individual stars, constellations, and sometimes planets, depicting where they are in relation to one another and to various celestial coordinates. Star Charts provide guidance in navigating the night sky and aiding in the study of different celestial phenomena. They can be particularly helpful for amateur astronomers and education purposes.
Star Charts/Diagrams, which map out celestial bodies and phenomena, are generally compiled and filed by astronomers and astrophysicists. These professionals might work for various institutions, including universities, research institutions, or government agencies like NASA (in the USA), the Indian Space Research Organisation (in India), the Canadian Space Agency (in Canada), or the Commonwealth Scientific and Industrial Research Organisation (in Australia). Astronomy enthusiasts may also create their own star charts/diagrams for personal use.
FAQ
Q: What is a star chart or star diagram?
A: A star chart, also known as a star map or constellation diagram, is a map of the night sky. Astronomers use these charts to locate and identify celestial objects such as stars, constellations, galaxies, and planets.
Q: How do you read a star chart?
A: To read a star chart, you need to match the chart with the sky based on your location, date, and time. The chart usually presents the sky from a specific latitude, so you need to know your location. The outer edge of the chart corresponds to the horizon while the center corresponds to the point directly overhead, or the zenith.
Q: How is a star chart or diagram used in astronomy?
A: In astronomy, star charts are used to navigate the night skies. They allow astronomers to locate specific stars, constellations, and other celestial bodies. They're also used in astro-imaging to locate and target objects for photography.
Q: Are star charts or diagrams the same throughout the world?
A: No, the appearance of the night sky changes depending on the observer's location, date, and time. The night sky is divided into Northern and Southern Hemispheres. As a result, a star chart made for viewers in Australia, for instance, would not be accurate for viewers in the USA or Canada.
Q: What is the most famous star chart?
A: One of the most famous star charts is the 'Uranographia' by Johann Bayer, published in 1603. It introduced a system of designating the brightest stars in each constellation by a Greek letter, a system still used today.
Q: Can I use star charts for amateur stargazing?
A: Yes, star charts are an excellent tool for amateur astronomers and stargazers. They can help identify constellations and stars visible from a given location, making stargazing more interactive and educational.
Q: Is there any digital tool for star charts?
A: Yes, there are many sky-gazing apps and software that provide interactive star charts and diagrams. These tools adjust based on your location and the current date and time, offering a real-time map of the night sky.
