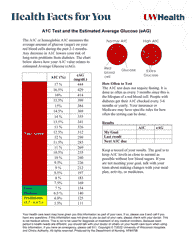
Hba1c & Blood Glucose Levels Chart

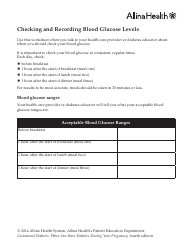
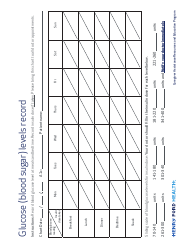
The Hba1c & Blood Glucose Levels Chart is used to monitor and track a person's blood sugar levels over time. It helps in managing diabetes and assessing how well a person is controlling their blood glucose levels.
The Hba1c & blood glucose levels chart is typically filed by healthcare professionals or doctors who are monitoring the patient's diabetes or blood sugar levels.
FAQ
Q: What is HbA1c?
A: HbA1c stands for Hemoglobin A1c, a blood test that measures average blood sugar levels over the past 2-3 months.
Q: What is the normal range for HbA1c?
A: The normal range for HbA1c is typically below 5.7%.
Q: What does a higher HbA1c level indicate?
A: A higher HbA1c level indicates poorly controlled blood sugar levels and may suggest diabetes or a need for better diabetes management.
Q: What is the target HbA1c level for people with diabetes?
A: The target HbA1c level for people with diabetes is usually below 7%.
Q: What is blood glucose?
A: Blood glucose, or blood sugar, is the amount of sugar in your blood stream.
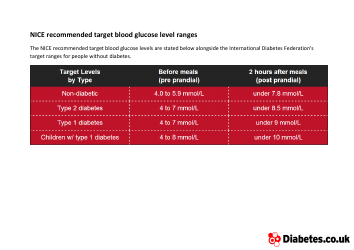
Q: What are normal blood glucose levels?
A: Normal blood glucose levels are typically between 70 and 99 mg/dL when fasting, and below 140 mg/dL two hours after eating.
Q: What does a higher blood glucose level indicate?
A: A higher blood glucose level may indicate diabetes or prediabetes, as well as the need for better blood sugar control.