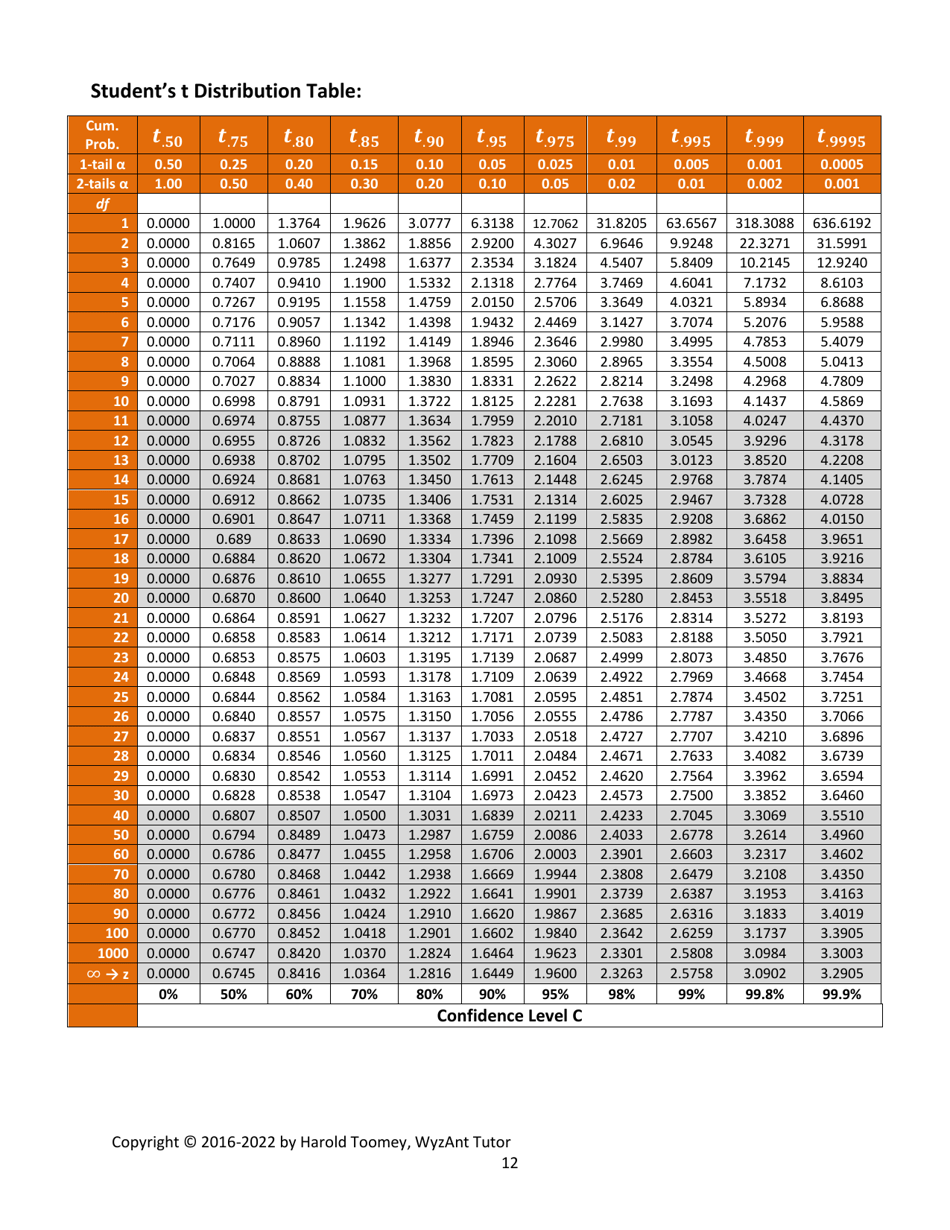
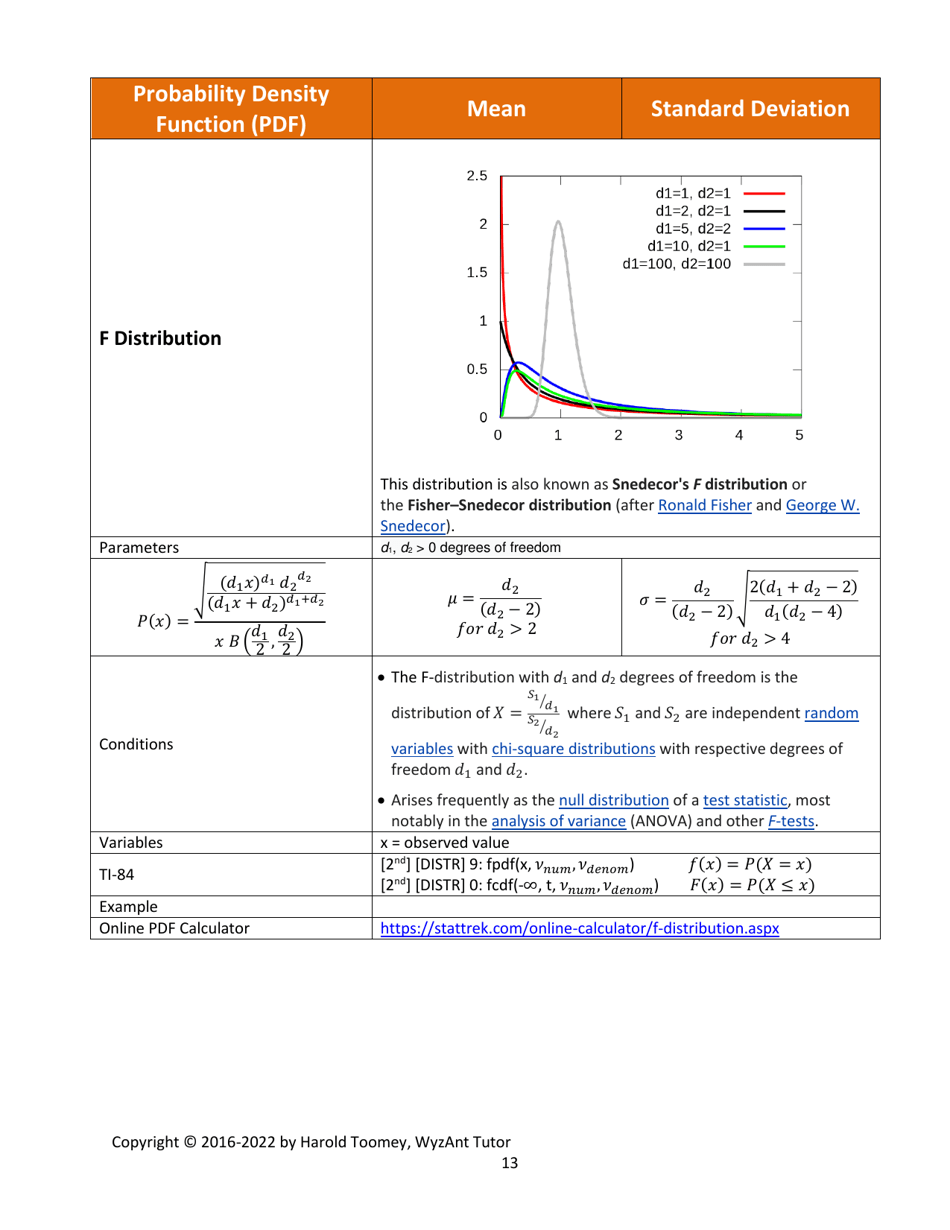
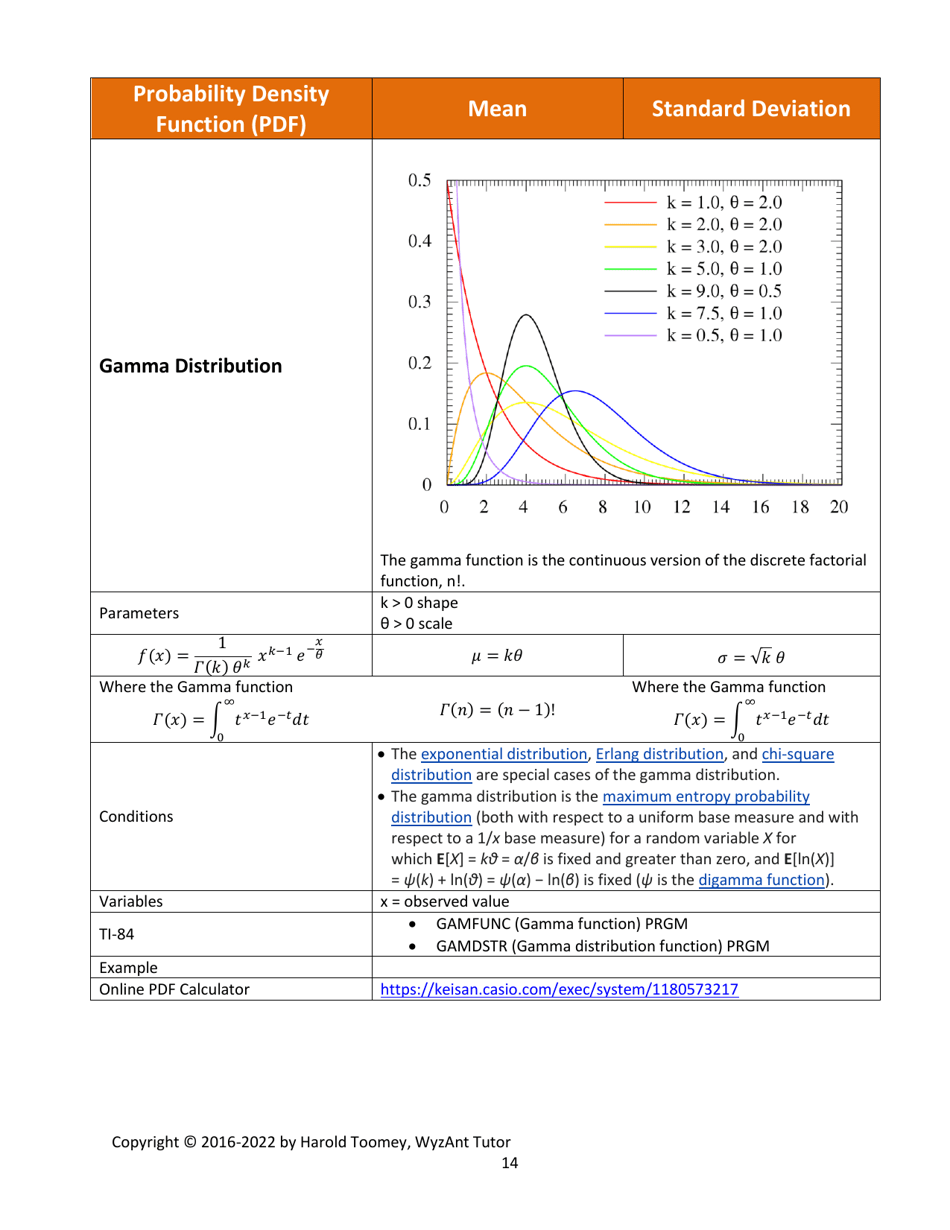
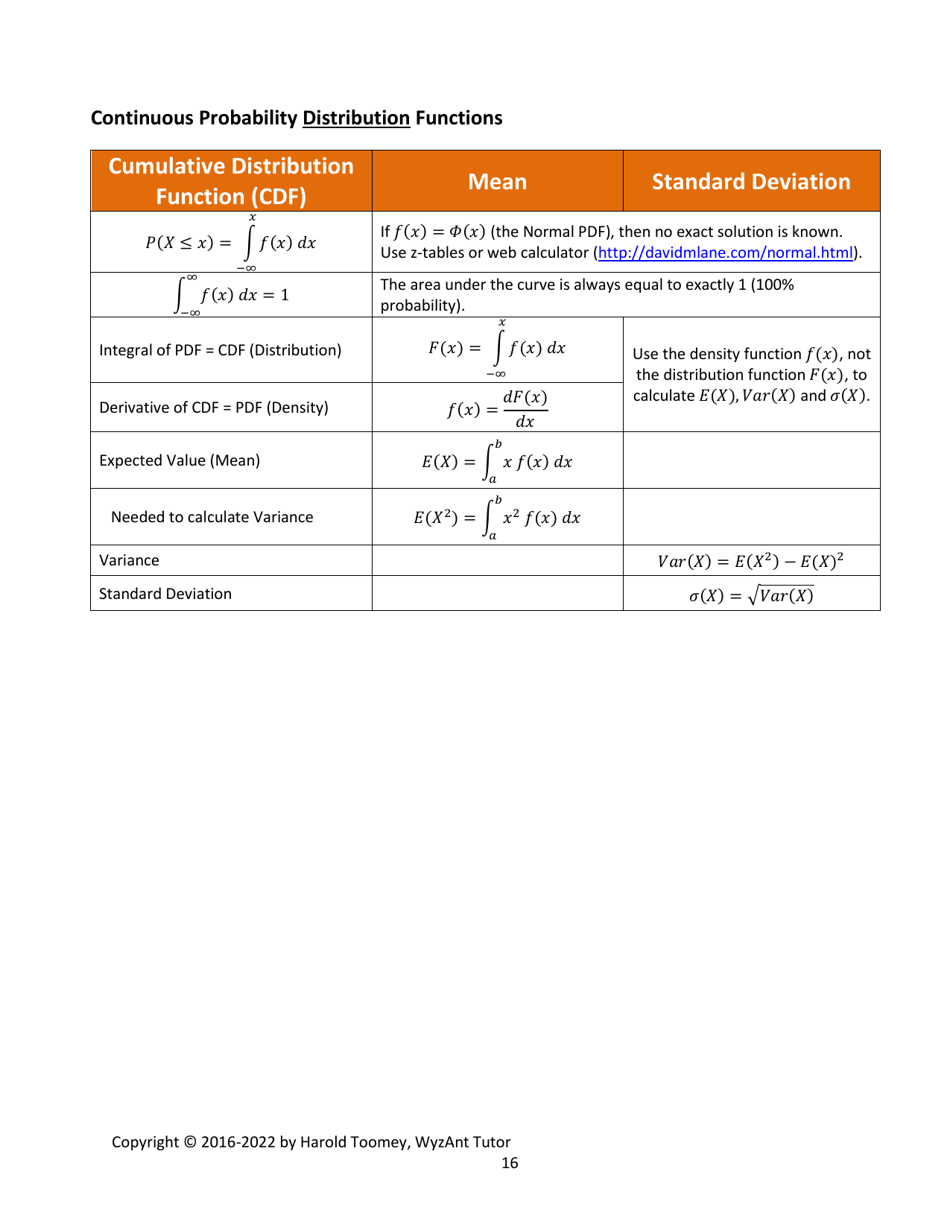
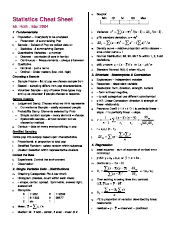
Harold's Statistical Distributions Cheat Sheet
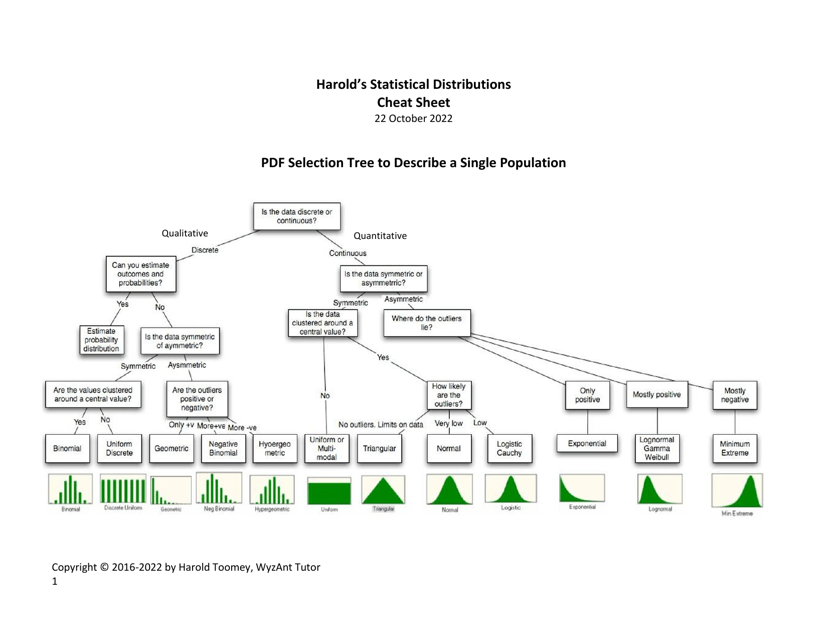
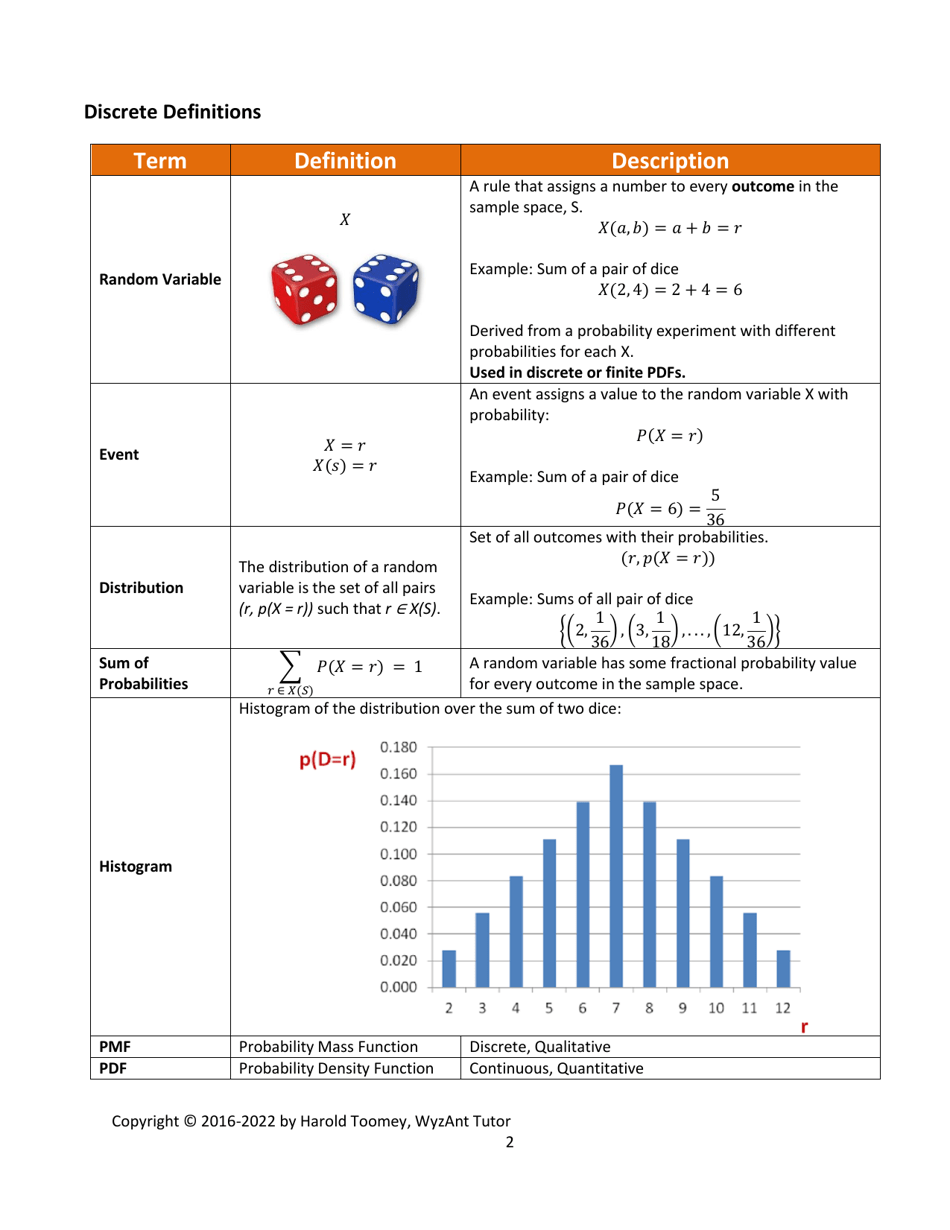
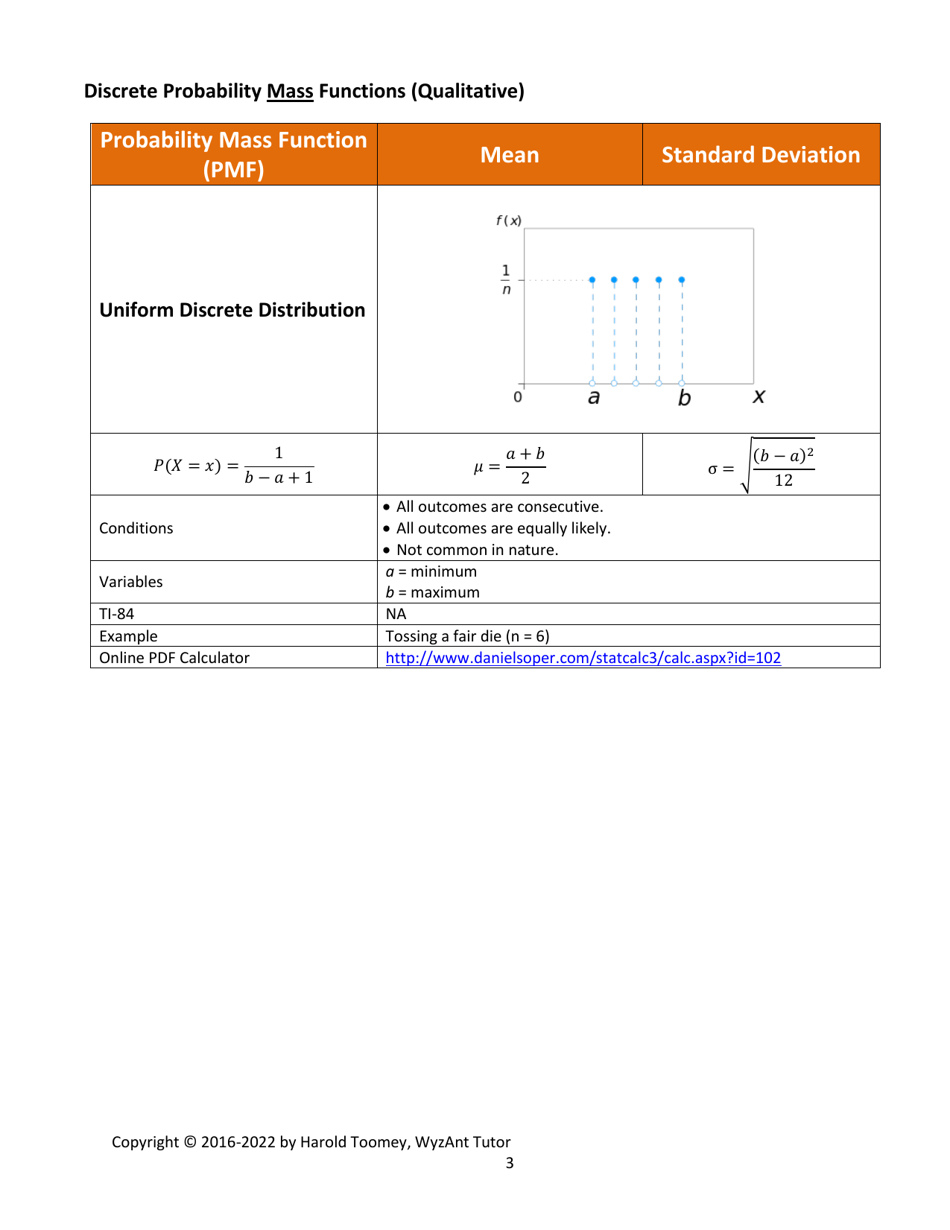
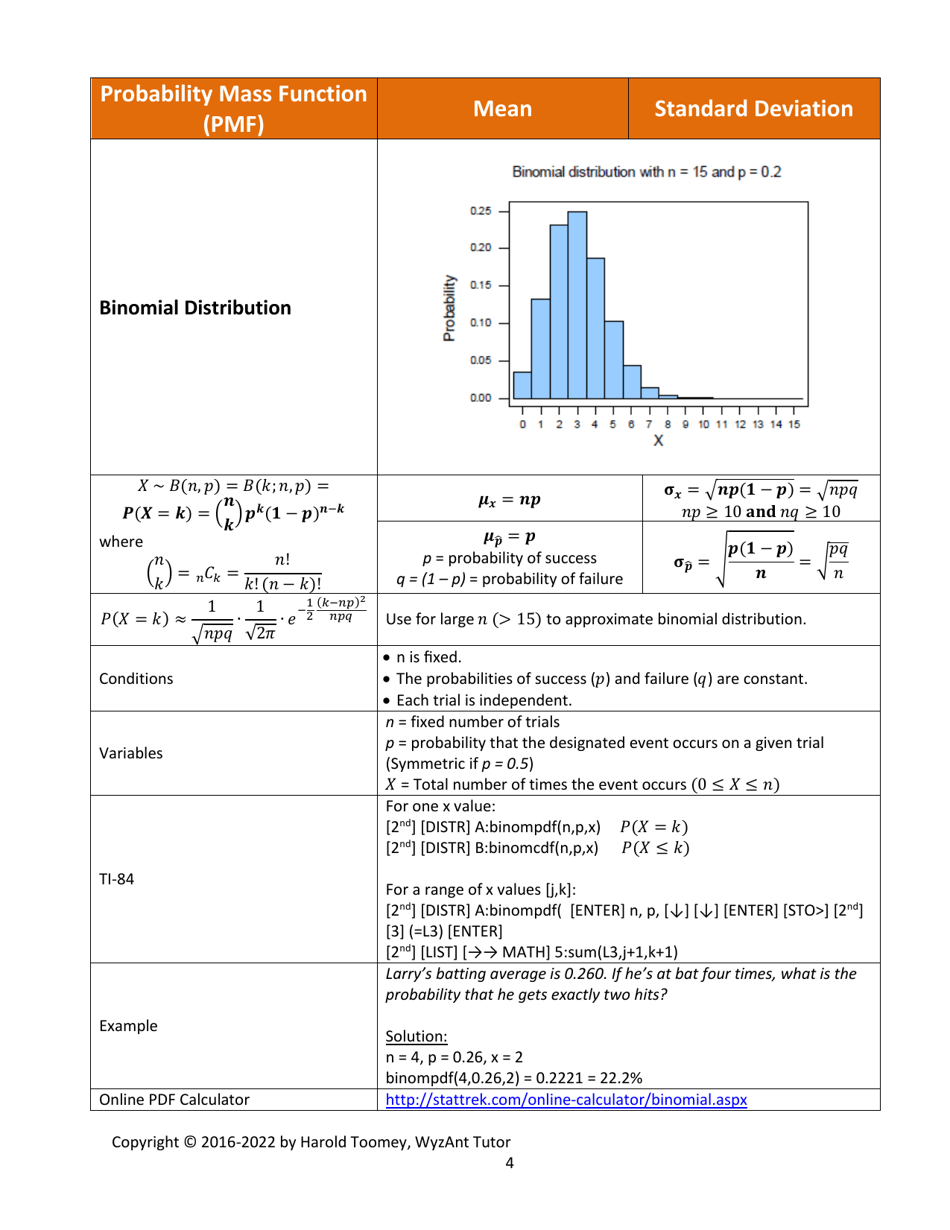
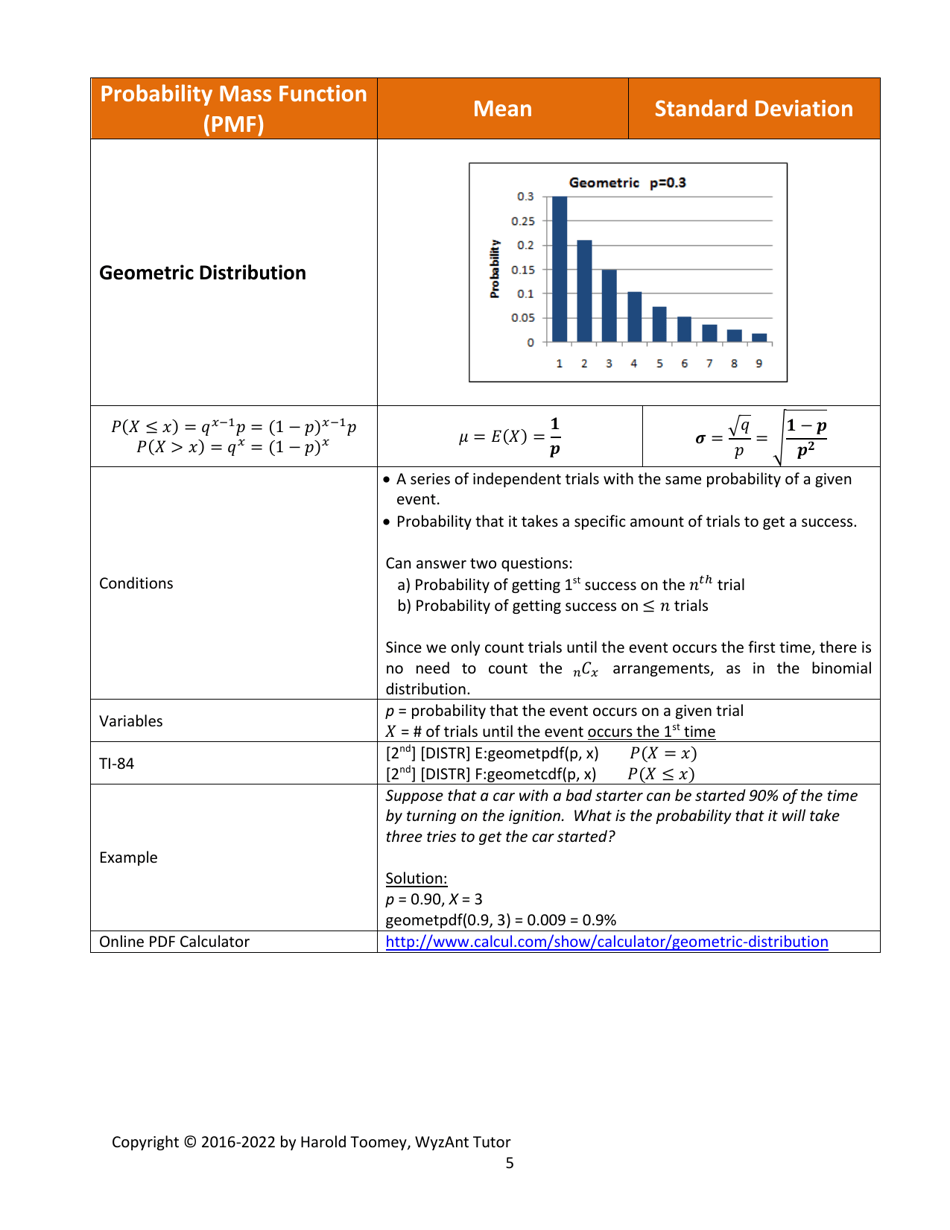
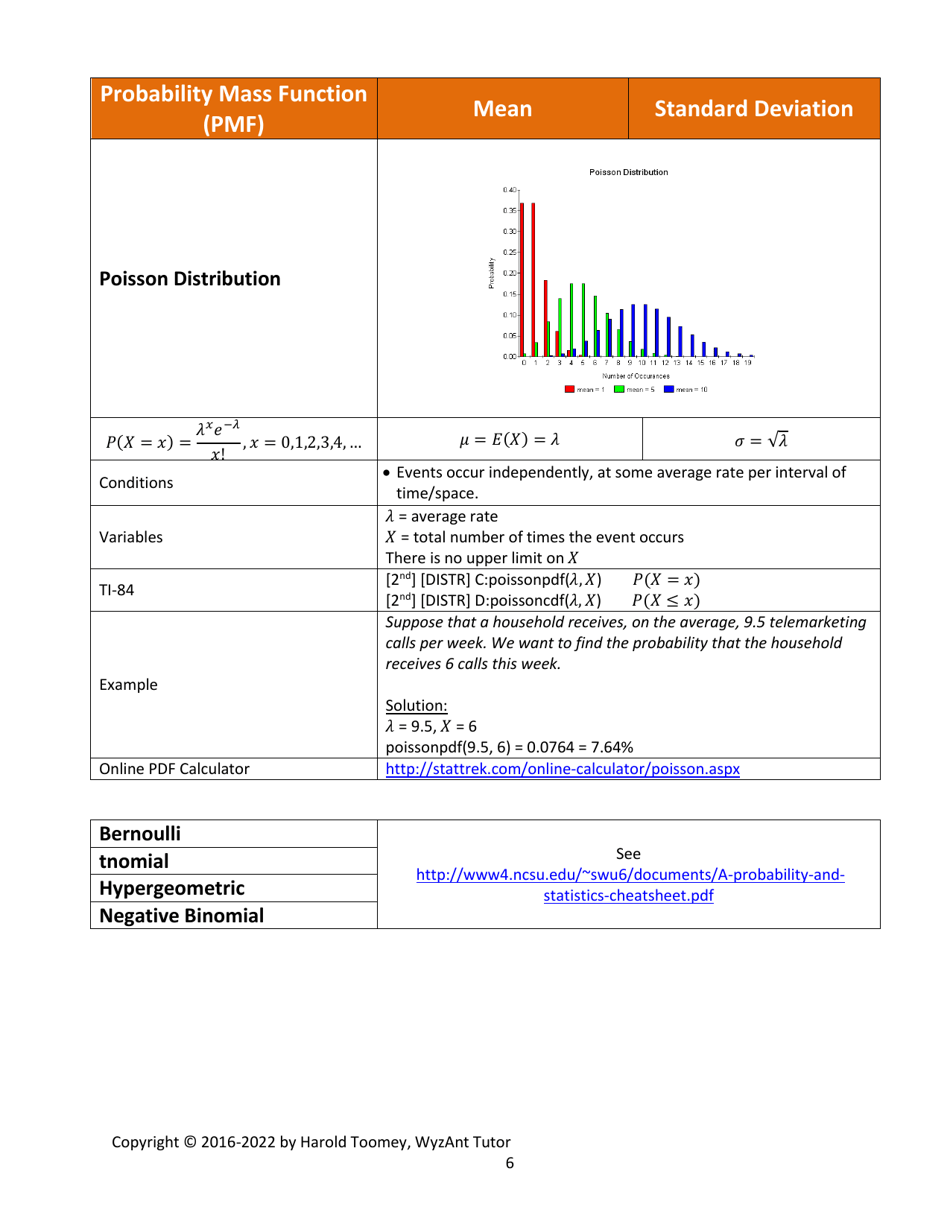
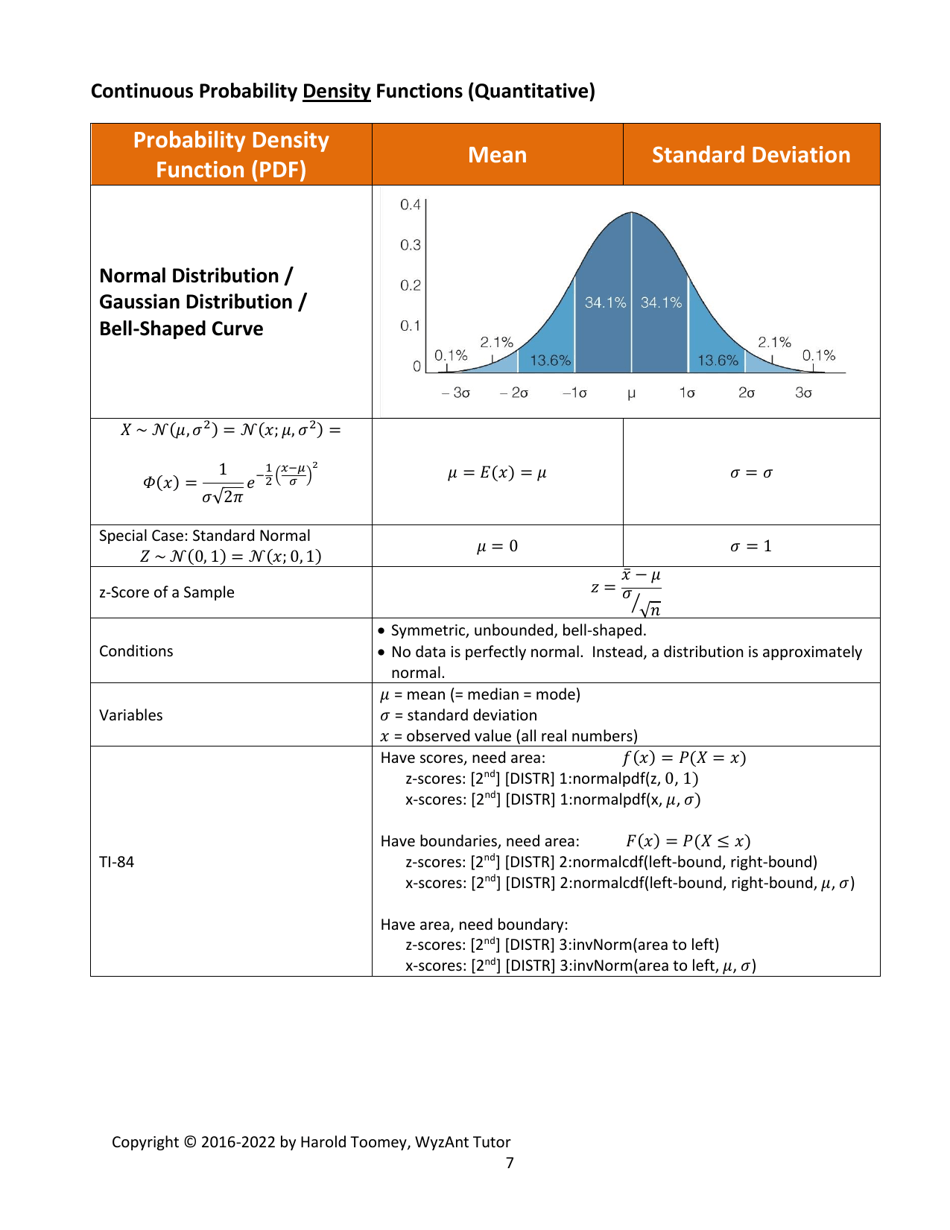
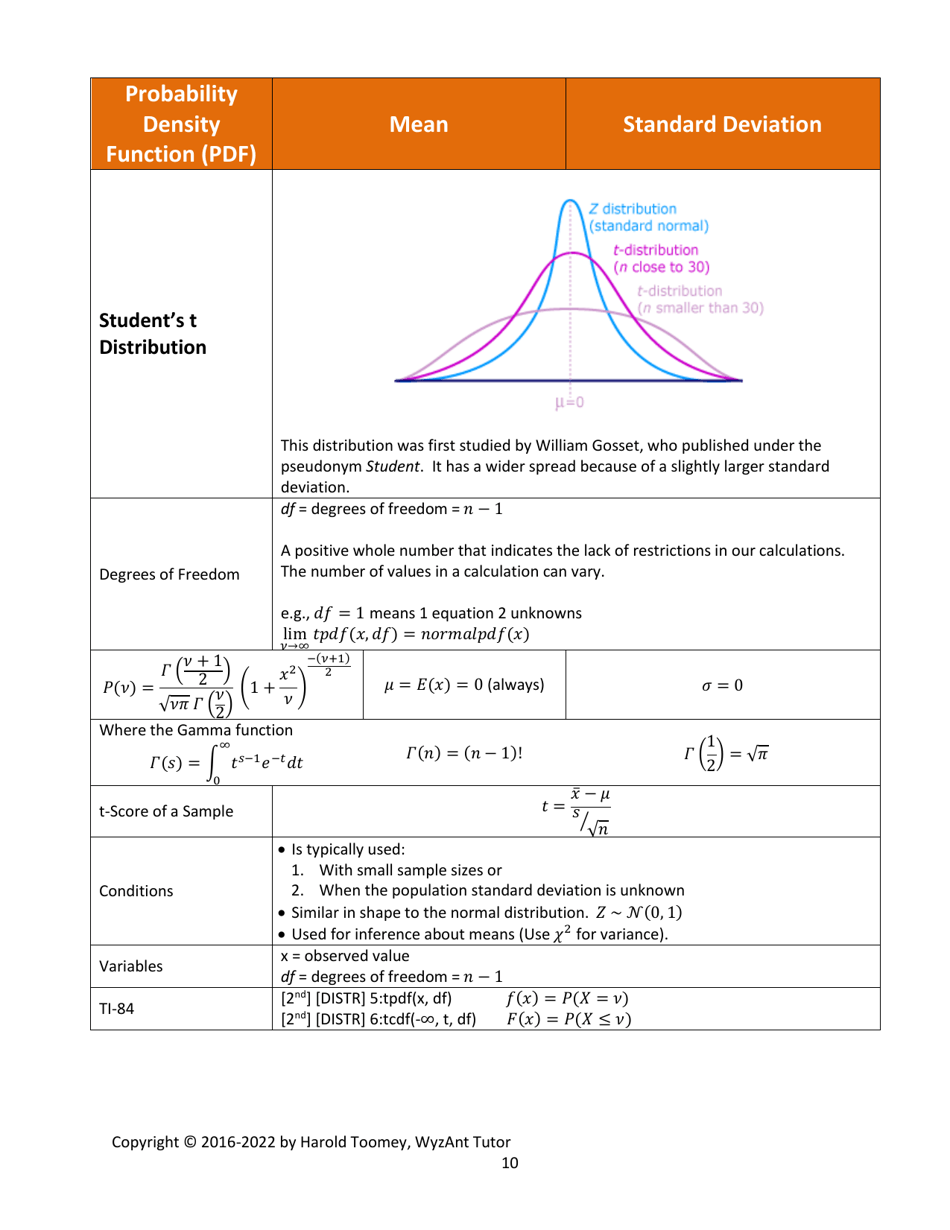
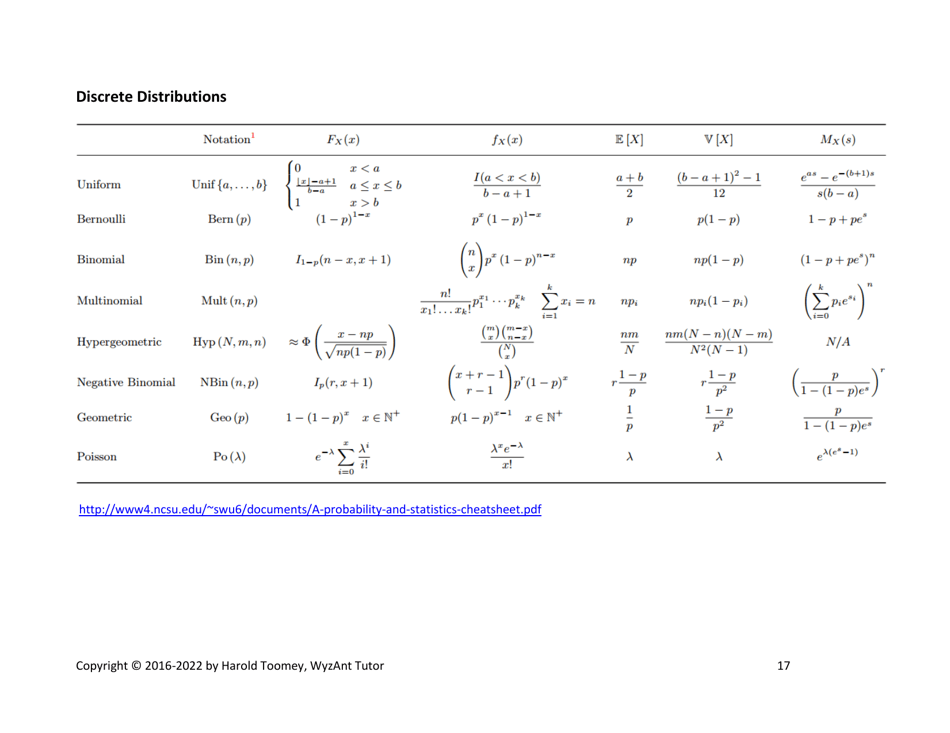
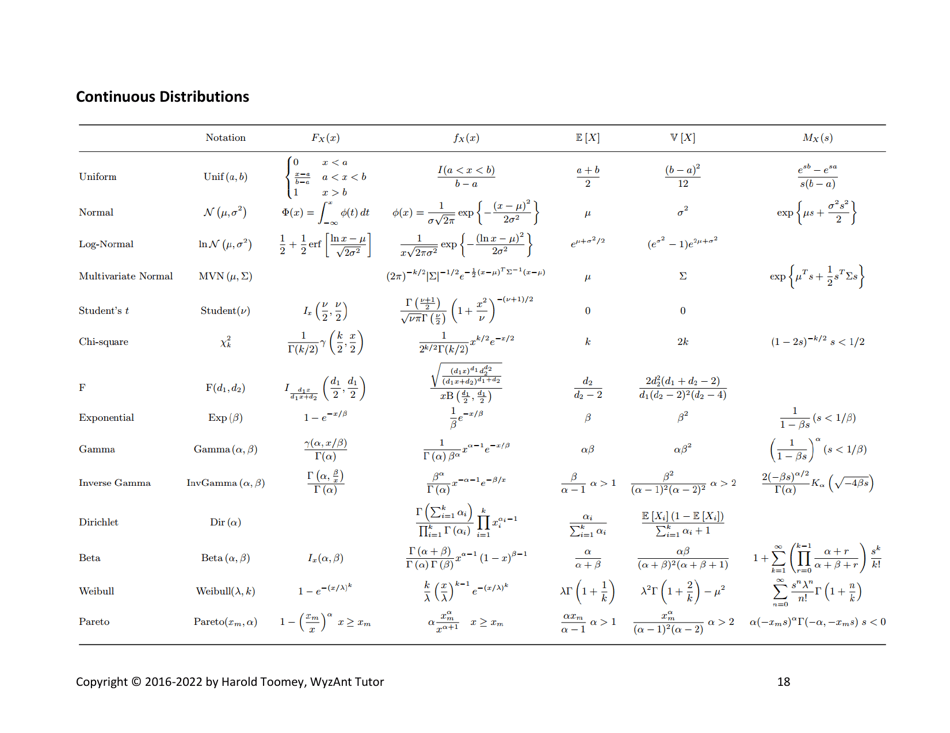
Harold's Statistical Distributions Cheat Sheet is a resource that provides summaries and formulas for different statistical distributions. It is designed to help individuals in understanding and applying statistical concepts and calculations.
FAQ
Q: What is a statistical distribution?
A: A statistical distribution describes the likelihood of different outcomes in a random process.
Q: Why are statistical distributions important?
A: Statistical distributions help us understand and analyze data, make predictions, and make decisions.
Q: What are some examples of statistical distributions?
A: Some examples include the normal distribution, the binomial distribution, and the Poisson distribution.
Q: What is the normal distribution?
A: The normal distribution, also known as the bell curve, is a symmetrical distribution that is commonly seen in nature and many statistical processes.
Q: What is the binomial distribution?
A: The binomial distribution describes the number of successes in a fixed number of independent Bernoulli trials, where each trial has the same probability of success.
Q: What is the Poisson distribution?
A: The Poisson distribution is used to model the number of events that occur in a fixed interval of time or space, assuming that the events occur independently and at a constant rate.
Q: How can I use statistical distributions in my analysis?
A: You can use statistical distributions to calculate probabilities, estimate parameters, generate random numbers, and perform hypothesis tests.
Q: Are statistical distributions the same as probability distributions?
A: Yes, statistical distributions and probability distributions are often used interchangeably to refer to the same concept.
