One-Page Gdb Cheat Sheet
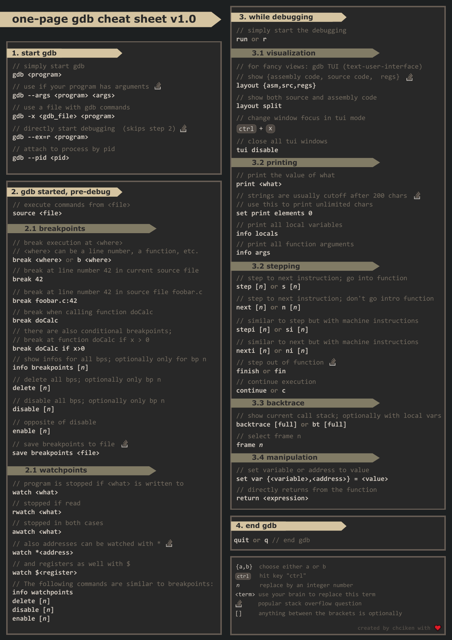
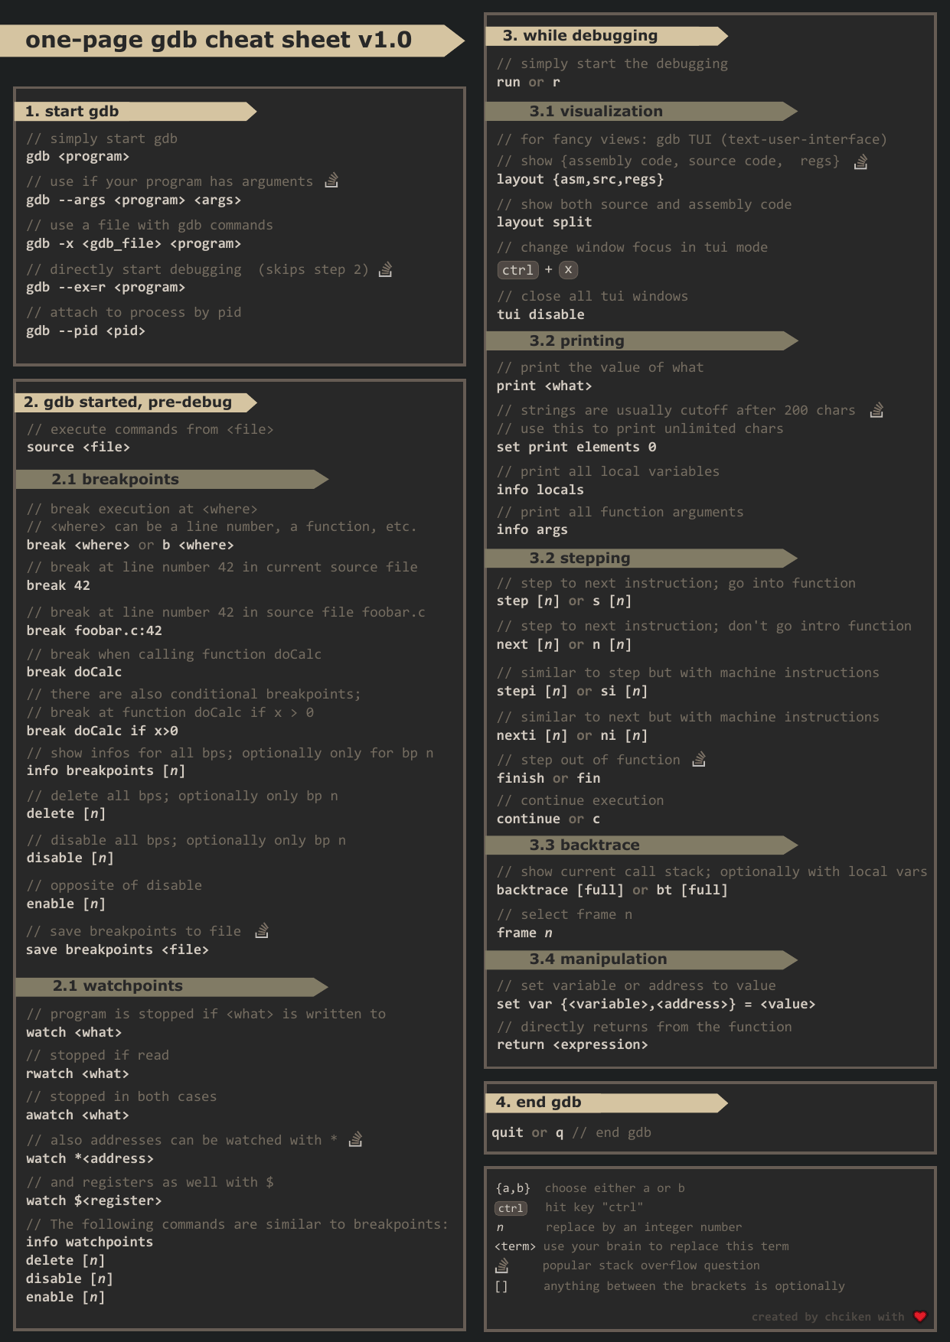
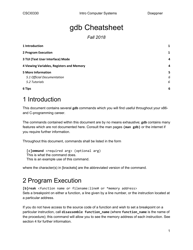
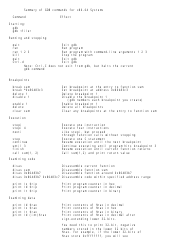
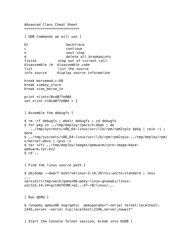
The One-Page Gdb Cheat Sheet is a reference guide that helps programmers to quickly access and utilize the debugging features of the GNU Debugger (GDB) tool. It provides a concise summary of commonly used commands and shortcuts for efficient debugging and problem-solving in software development.
FAQ
Q: What is GDB?
A: GDB stands for GNU Debugger, a powerful command-line tool for debugging programs.
Q: How do I start GDB?
A: You can start GDB by running the 'gdb' command in your terminal followed by the name of the program you want to debug.
Q: What are some basic commands in GDB?
A: Some basic commands in GDB are 'run' to start the program, 'break' to set breakpoints, 'step' to execute one line at a time, and 'print' to display variable values.
Q: How do I set a breakpoint in GDB?
A: You can set a breakpoint in GDB by using the 'break' command followed by the name of the function or line number where you want to pause the program.
Q: How do I continue running the program in GDB?
A: You can continue running the program in GDB by using the 'continue' command or by pressing 'c'.
Q: How do I view variable values in GDB?
A: You can view variable values in GDB by using the 'print' command followed by the name of the variable.
Q: How do I step through the program line by line in GDB?
A: You can step through the program line by line in GDB by using the 'step' command or by pressing 's'.
Q: How do I quit GDB?
A: You can quit GDB by using the 'quit' command or by pressing 'q'.
Q: Can GDB be used for debugging different programming languages?
A: Yes, GDB can be used for debugging programs written in various programming languages, including C, C++, and assembly language.
Q: Are there any graphical frontends available for GDB?
A: Yes, there are several graphical frontends available for GDB, such as DDD and Eclipse CDT.
