Probability Cheatsheet
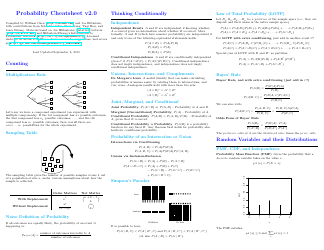
The Probability Cheatsheet is a document that provides a concise summary of key concepts and formulas related to probability. It can be used as a quick reference guide for understanding and solving probability problems.
FAQ
Q: What is probability?
A: Probability is a measure of the likelihood that an event will occur.
Q: What is the range of probability?
A: Probability ranges from 0 (impossible event) to 1 (certain event).
Q: How do you calculate probability?
A: Probability can be calculated by dividing the number of favorable outcomes by the number of possible outcomes.
Q: What is the probability of an event not occurring?
A: The probability of an event not occurring is equal to 1 minus the probability of the event occurring.
Q: What is the difference between theoretical probability and experimental probability?
A: Theoretical probability is based on mathematical calculations, while experimental probability is based on actual observations or experiments.
Q: What is conditional probability?
A: Conditional probability is the probability of an event occurring given that another event has already occurred.
Q: What is the multiplication rule in probability?
A: The multiplication rule states that the probability of two independent events occurring together is the product of their individual probabilities.
Q: What is the addition rule in probability?
A: The addition rule states that the probability of either of two mutually exclusive events occurring is the sum of their individual probabilities.
Q: What is the concept of expected value in probability?
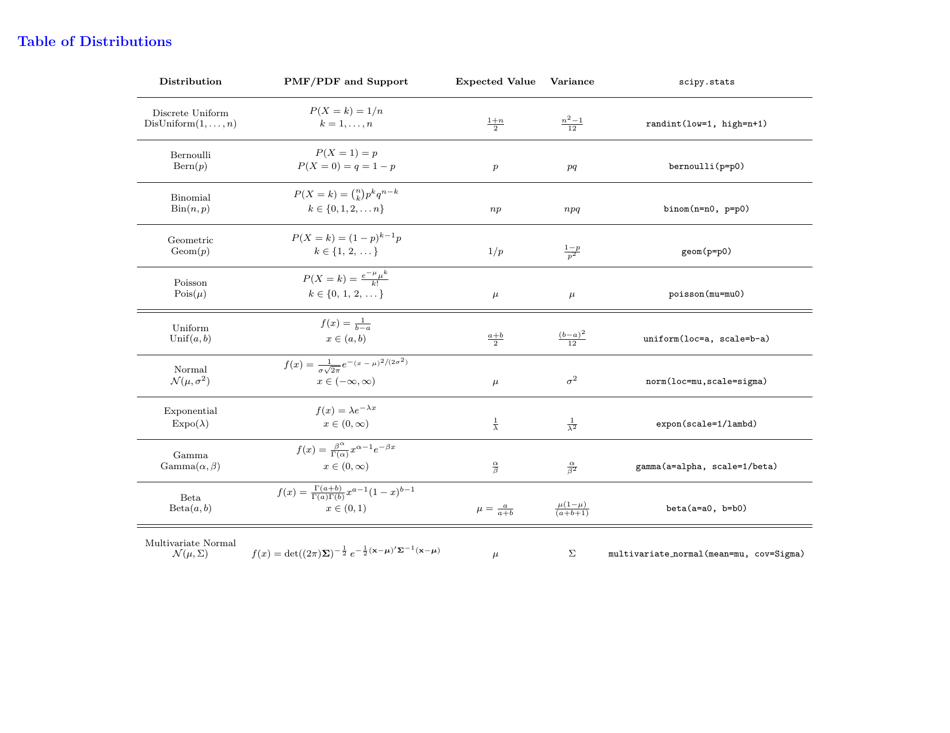
A: Expected value is a measure of the average outcome of a random experiment, calculated by multiplying each possible outcome by its probability and summing them up.
Q: What is the Law of Large Numbers?
A: The Law of Large Numbers states that as the number of trials in a probability experiment increases, the experimental probability will approach the theoretical probability.
Q: What is a sample space in probability?
A: A sample space is the set of all possible outcomes of an experiment. It is often represented using a list, a tree diagram, or a Venn diagram.
