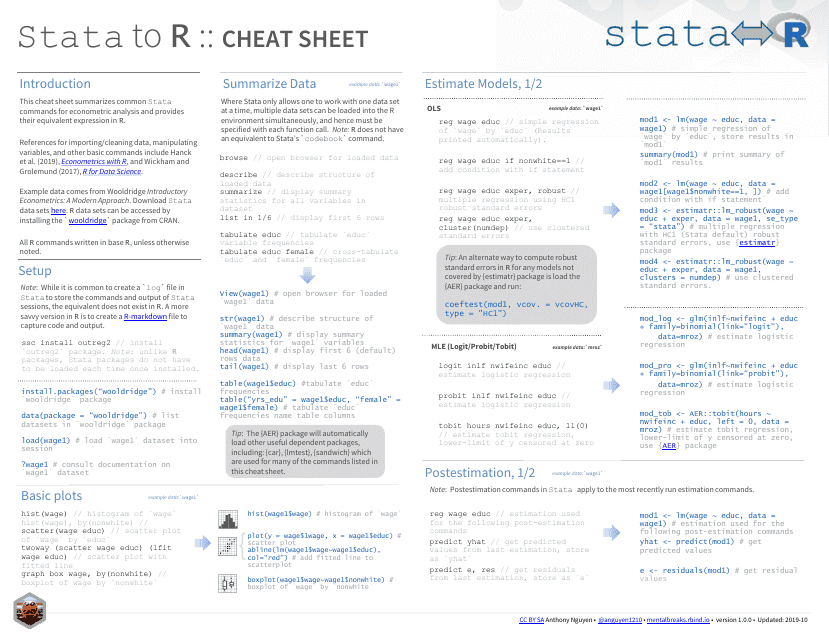
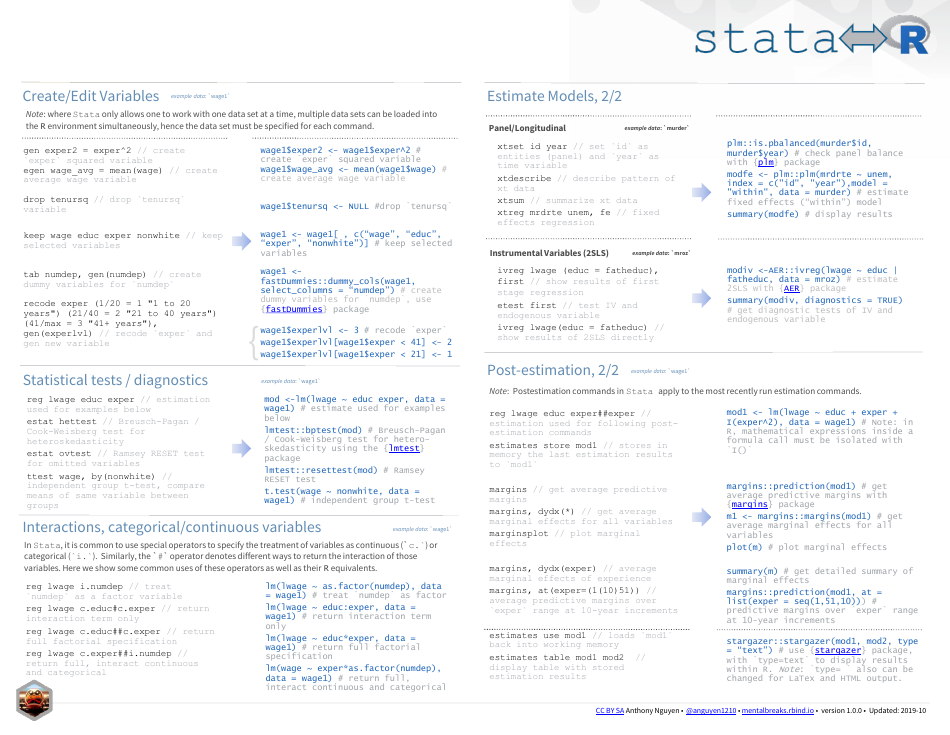
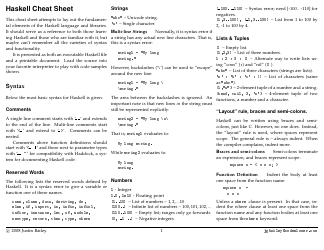
Stata Cheat Sheet
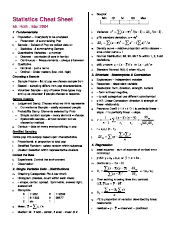
A Stata Cheat Sheet is a quick reference guide that provides succinct explanations and examples of commonly used commands and functions in the Stata statistical software. It helps users remember syntax and perform tasks efficiently.
FAQ
Q: What is Stata?
A: Stata is a statistical software package used for data analysis and visualization.
Q: What are some features of Stata?
A: Stata has a wide range of features including data management, statistical analysis, graphics, and programming.
Q: How can Stata be used?
A: Stata can be used for analyzing and manipulating data, running statistical tests, creating graphs and visualizations, and automating tasks through programming.
Q: What types of analyses can be done in Stata?
A: Stata supports a variety of statistical analyses, such as regression, logistic regression, ANOVA, time series analysis, and survival analysis.
Q: Is Stata user-friendly?
A: Stata provides a user-friendly interface with point-and-click features, as well as a command line interface for advanced users.
Q: Is Stata popular?
A: Yes, Stata is widely used in the fields of social sciences, economics, and public health for data analysis and research.
Q: Can Stata handle large datasets?
A: Yes, Stata has the ability to efficiently handle and analyze large datasets.
Q: What is the cost of Stata?
A: Stata is a commercial software with different licenses available at varying costs.
Q: Does Stata support data visualization?
A: Yes, Stata provides a wide range of options for creating high-quality graphs and visualizations.
