Graphs of Trigonometry Functions Cheat Sheet
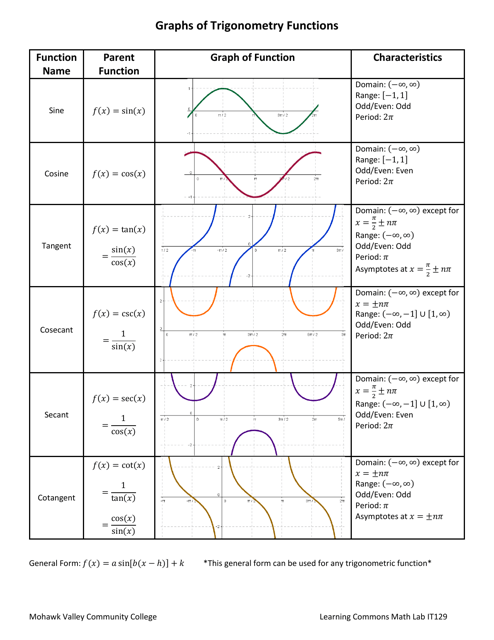
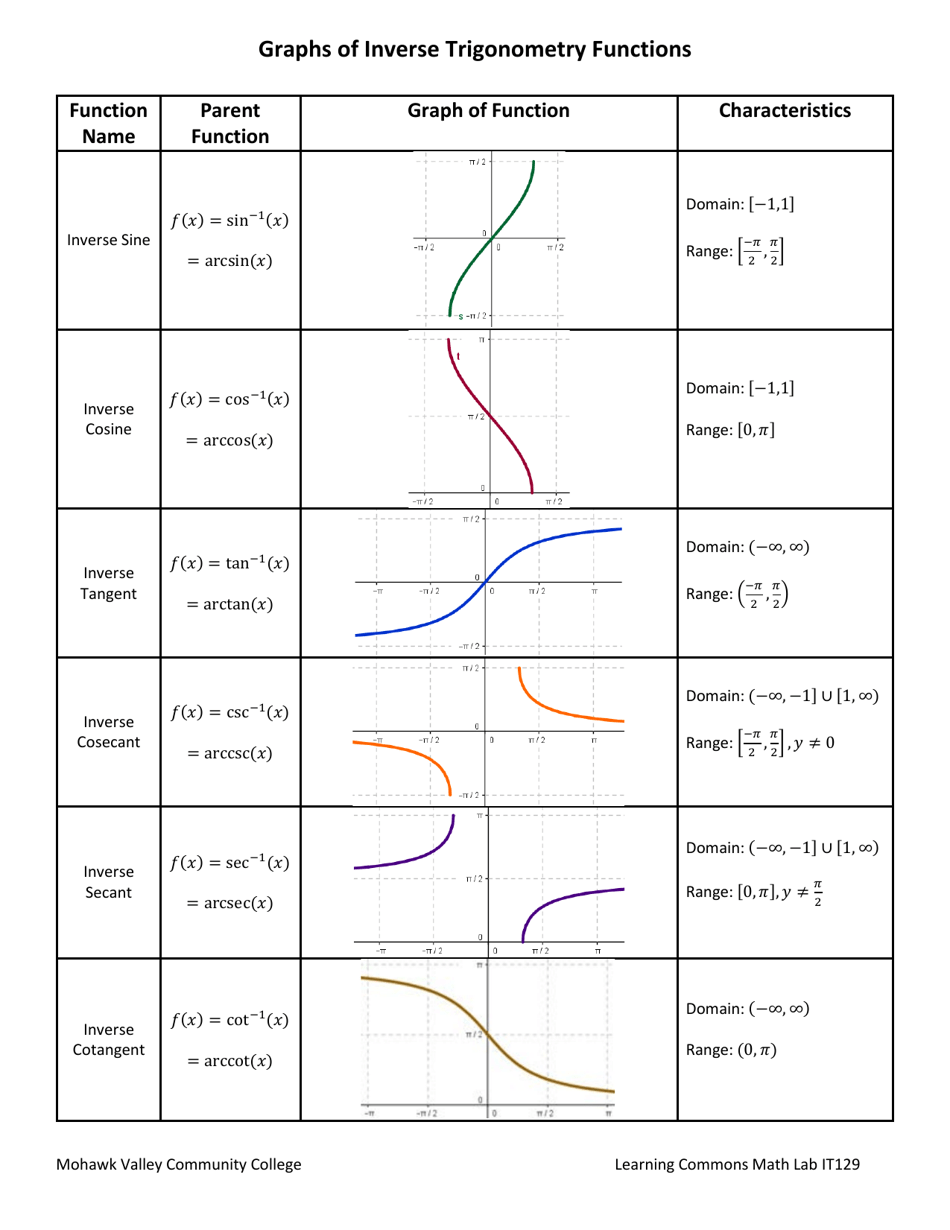
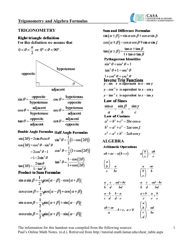
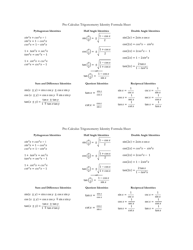
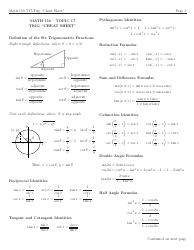
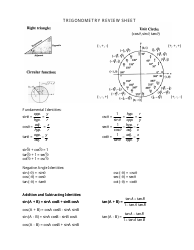
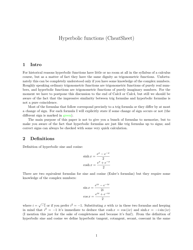
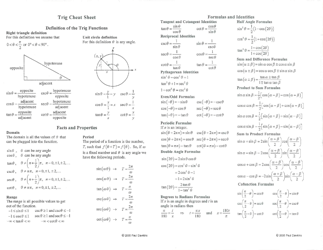
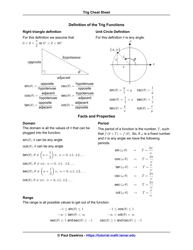
The Graphs of Trigonometry Functions Cheat Sheet is a reference guide that provides a visual representation of the graphs of various trigonometric functions such as sine, cosine, and tangent. It helps users understand and remember the patterns and properties of these functions.
FAQ
Q: What is a trigonometry function?
A: A trigonometry function is a mathematical function that relates the angles of a right triangle to the lengths of its sides.
Q: What are some common trigonometry functions?
A: Some common trigonometry functions include sine, cosine, and tangent.
Q: What does the sine function represent?
A: The sine function represents the ratio of the length of the side opposite an angle to the length of the hypotenuse in a right triangle.
Q: What does the cosine function represent?
A: The cosine function represents the ratio of the length of the adjacent side to the length of the hypotenuse in a right triangle.
Q: What does the tangent function represent?
A: The tangent function represents the ratio of the length of the side opposite an angle to the length of the adjacent side in a right triangle.
Q: What are some key properties of trigonometry functions?
A: Some key properties of trigonometry functions include periodicity, symmetry, and their relationships to each other.
Q: How can trigonometry functions be graphed?
A: Trigonometry functions can be graphed by plotting points based on the angles and corresponding function values, or by using the unit circle.
