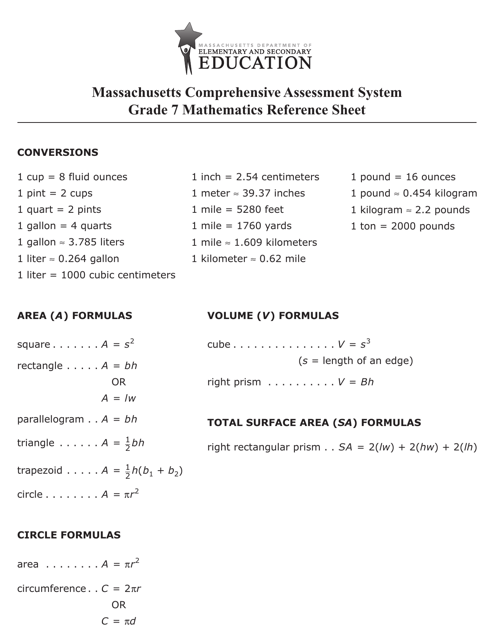
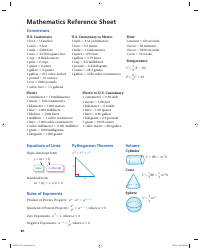
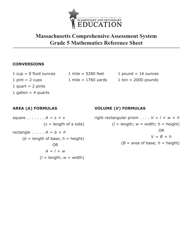
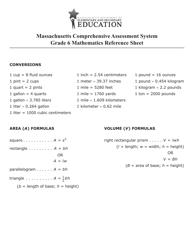
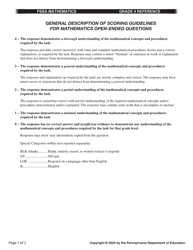
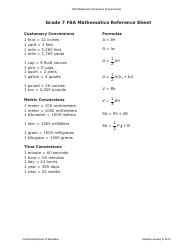
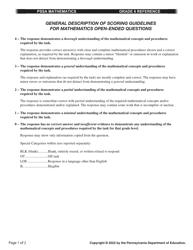
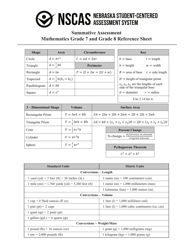
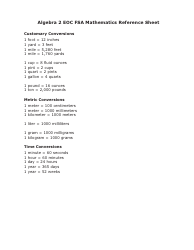
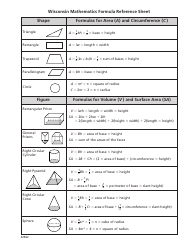
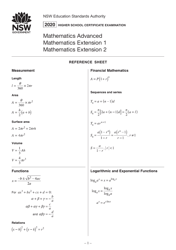
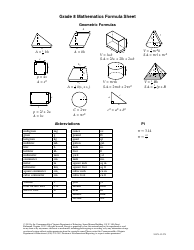
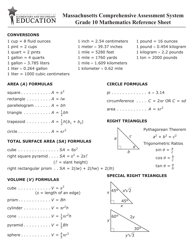
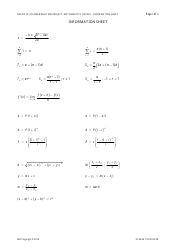
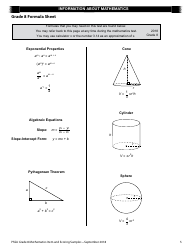
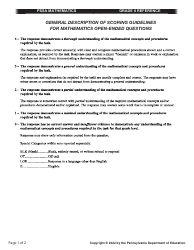
Grade 7 Mathematics Reference Sheet
The Grade 7 Mathematics Reference Sheet is a tool that students can use to help them solve problems and remember important mathematical concepts. It includes formulas, conversions, and other information that may be needed during math assignments or tests.
FAQ
Q: What topics are covered in Grade 7 Mathematics?
A: Grade 7 Mathematics covers a variety of topics, including ratios and proportional relationships, the number system, expressions and equations, geometry, and statistics and probability.
Q: What is a ratio?
A: A ratio is a comparison of two quantities using division. It shows how many times one quantity contains or is contained within another.
Q: What is a proportion?
A: A proportion is an equation that states that two ratios are equivalent.
Q: What is a prime number?
A: A prime number is a number greater than 1 that has no positive divisors other than 1 and itself.
Q: What is the difference between a rational and irrational number?
A: A rational number can be expressed as a fraction or a terminating or repeating decimal, while an irrational number cannot be expressed as a fraction and has a non-repeating decimal representation.
Q: What are the properties of operations (addition, subtraction, multiplication, and division)?
A: The properties of operations include the commutative property (changing the order of the numbers does not change the result), the associative property (changing the grouping of the numbers does not change the result), the identity property (adding or multiplying by 0 does not change the result), and the distributive property (multiplication distributes over addition and subtraction).
Q: What is the Pythagorean Theorem?
A: The Pythagorean Theorem states that in a right triangle, the square of the length of the hypotenuse is equal to the sum of the squares of the lengths of the other two sides.
Q: What is the formula for the area of a rectangle?
A: The formula for the area of a rectangle is length times width.
Q: What is the difference between mean, median, and mode?
A: The mean is the average of a set of numbers, the median is the middle value in a set of numbers (or the average of the two middle values if there is an even number of values), and the mode is the value that appears most frequently in a set of numbers.
Q: What is the difference between a line plot and a histogram?
A: A line plot is a graphical representation of data that shows the frequency of each value along a number line, while a histogram is a graphical representation of data that shows the frequency of each value within a certain range.
