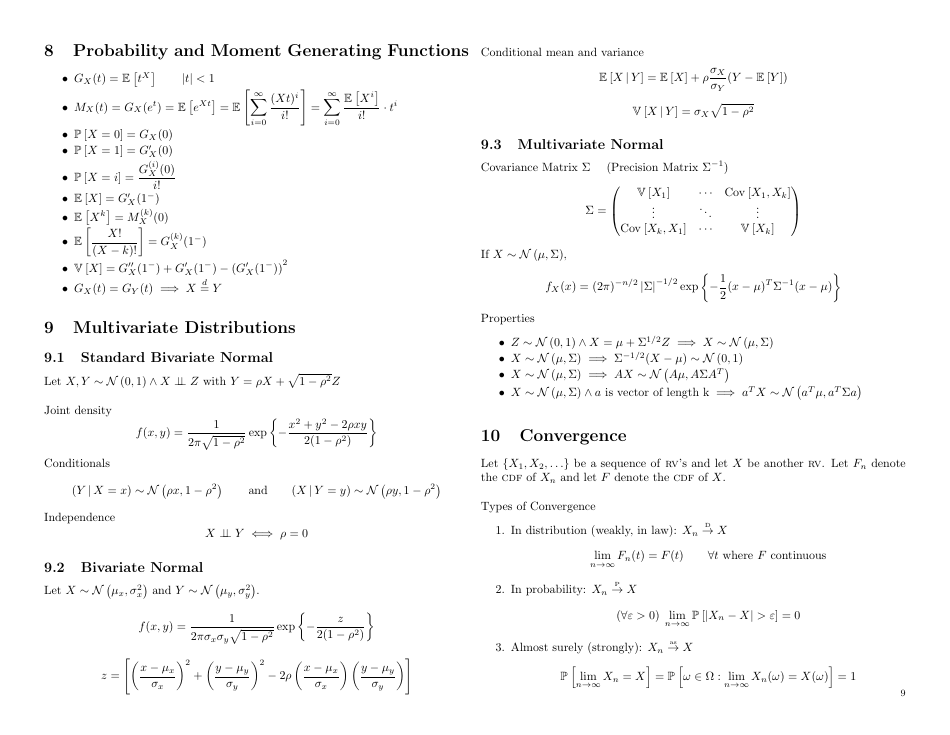
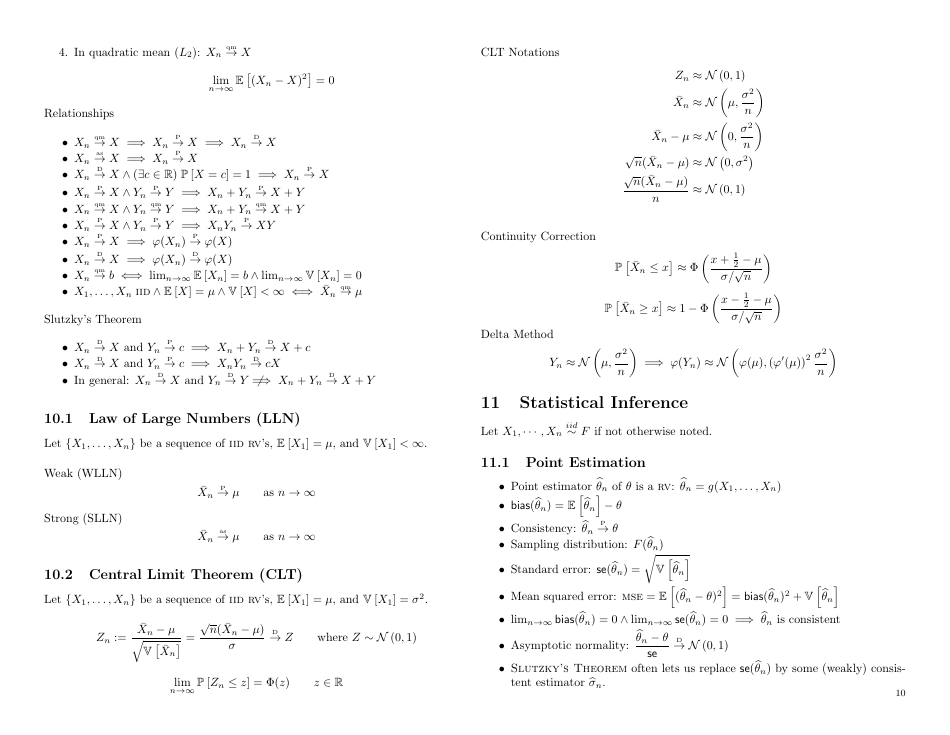
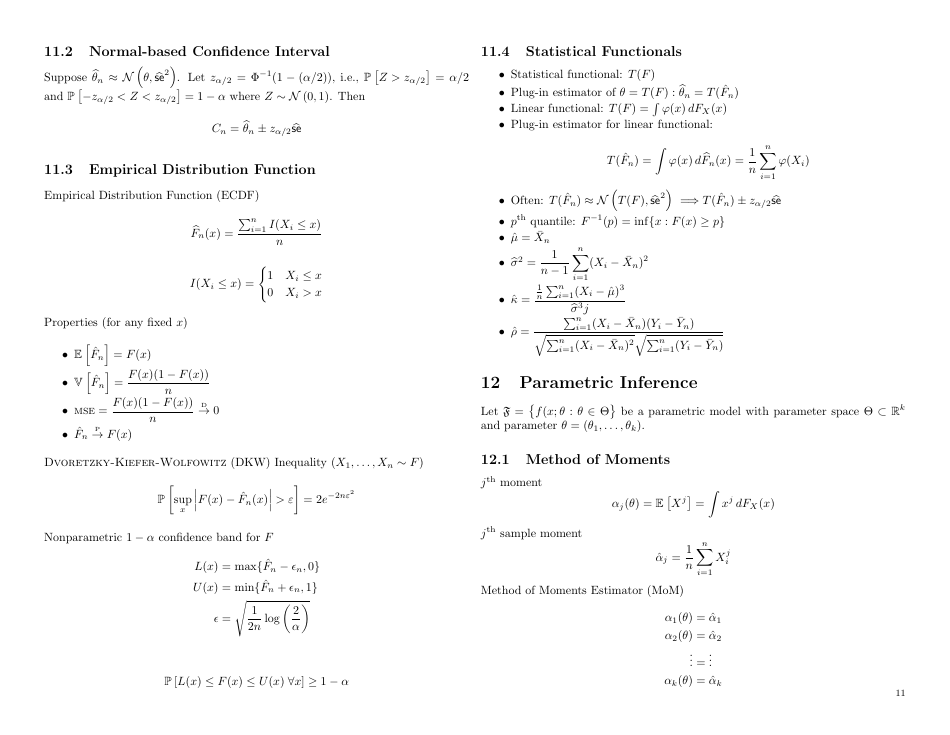
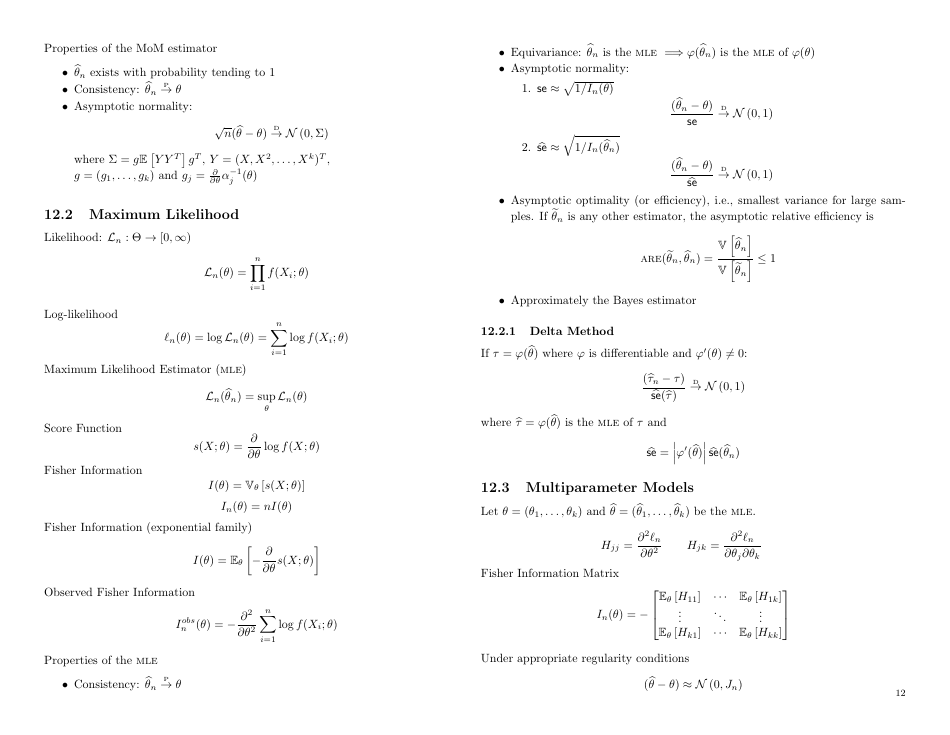
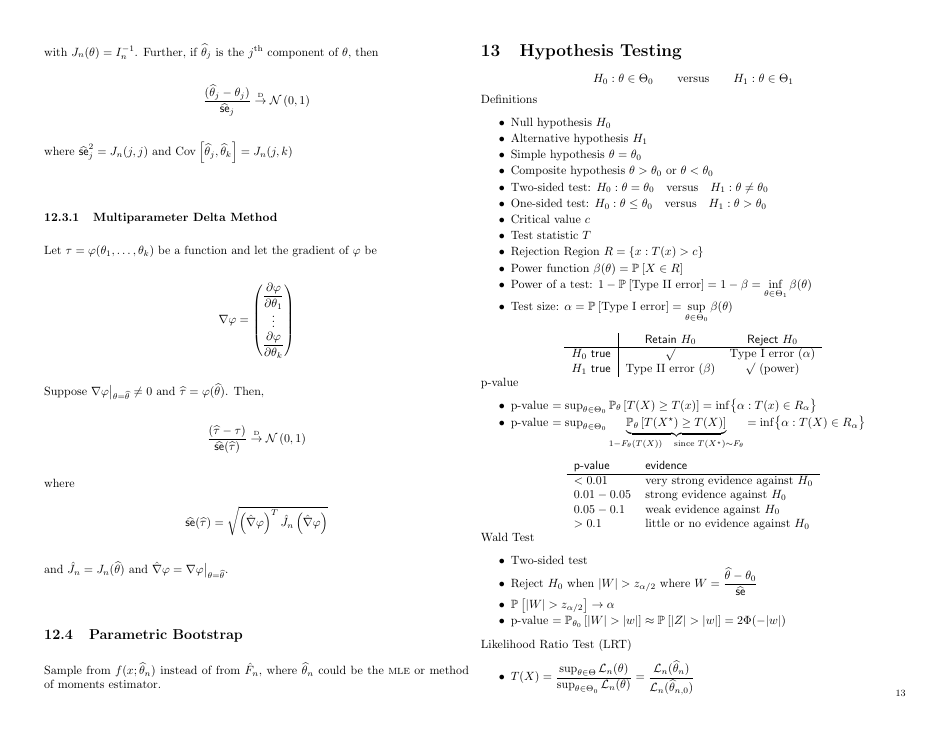
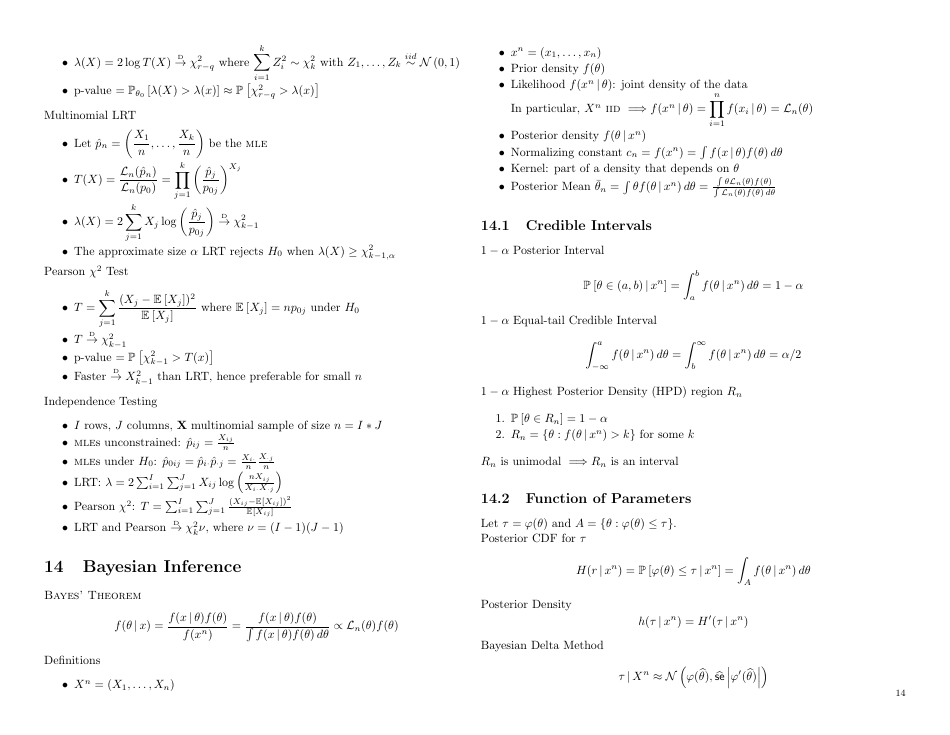
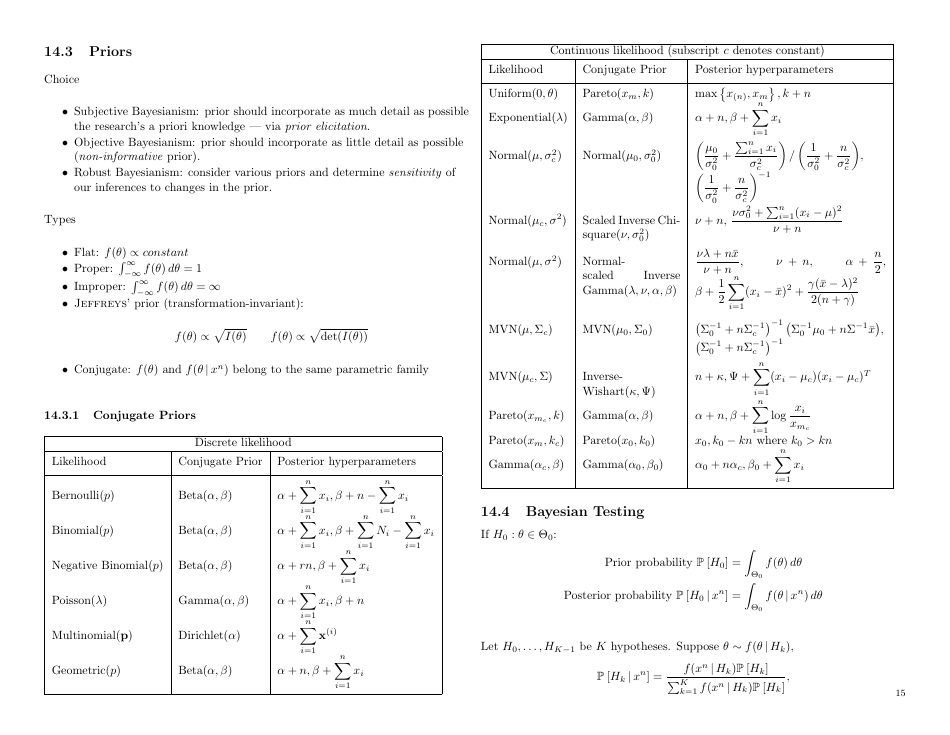
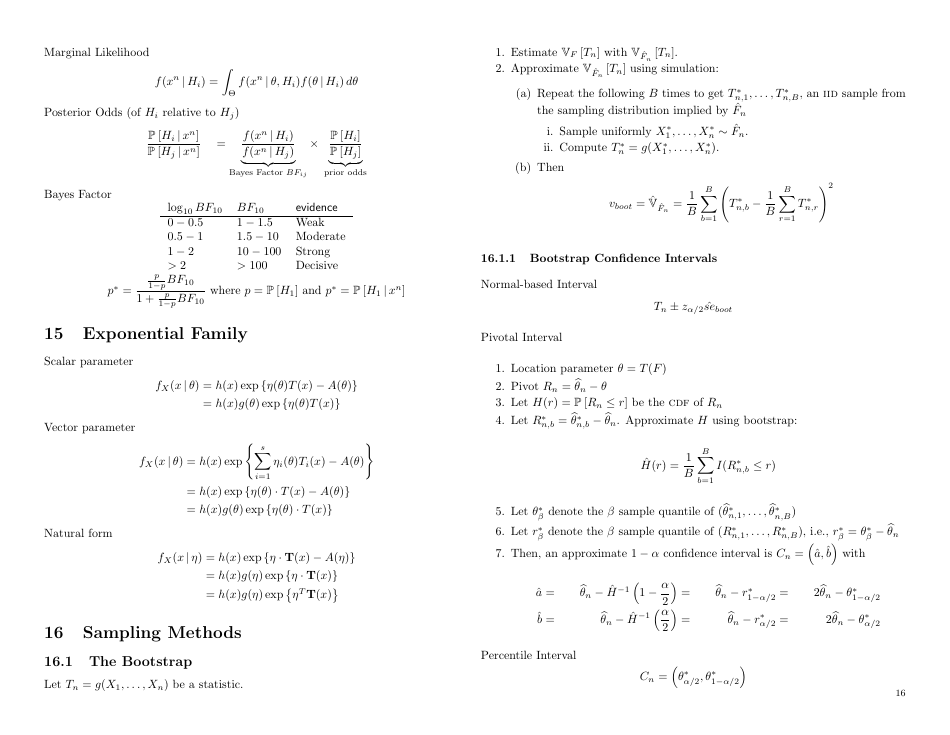
Probability and Statistics Cheat Sheet - Matthias Vallentin
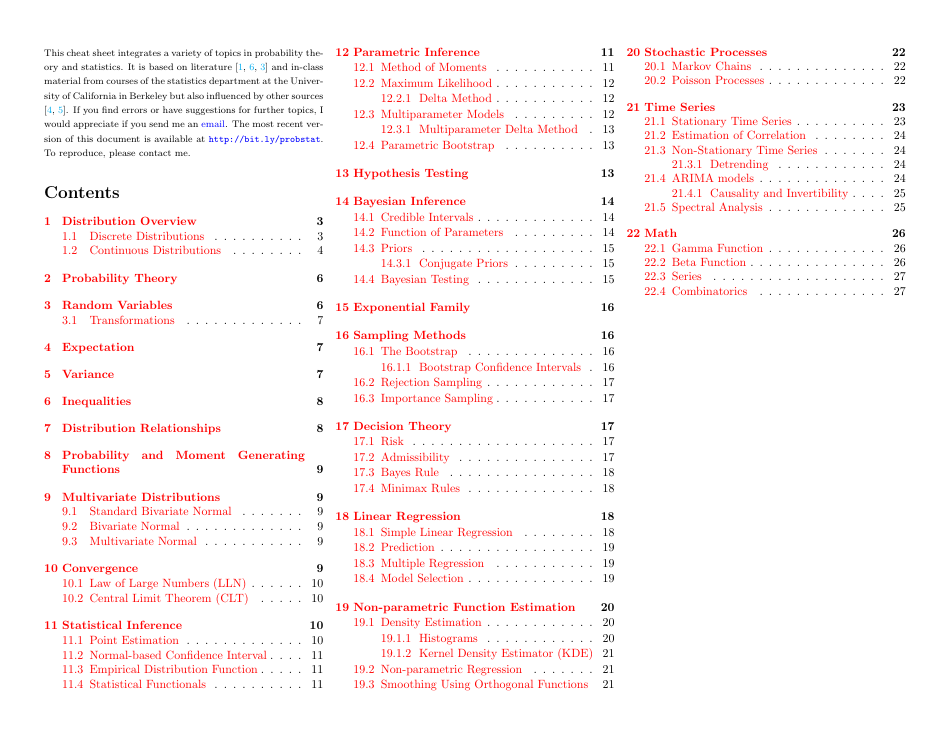
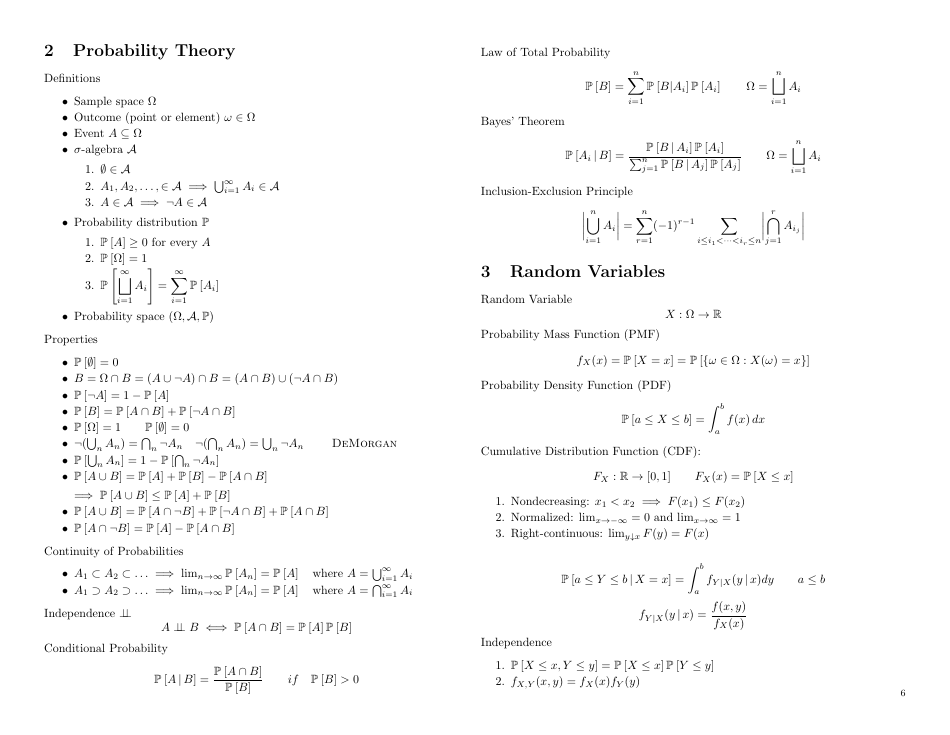
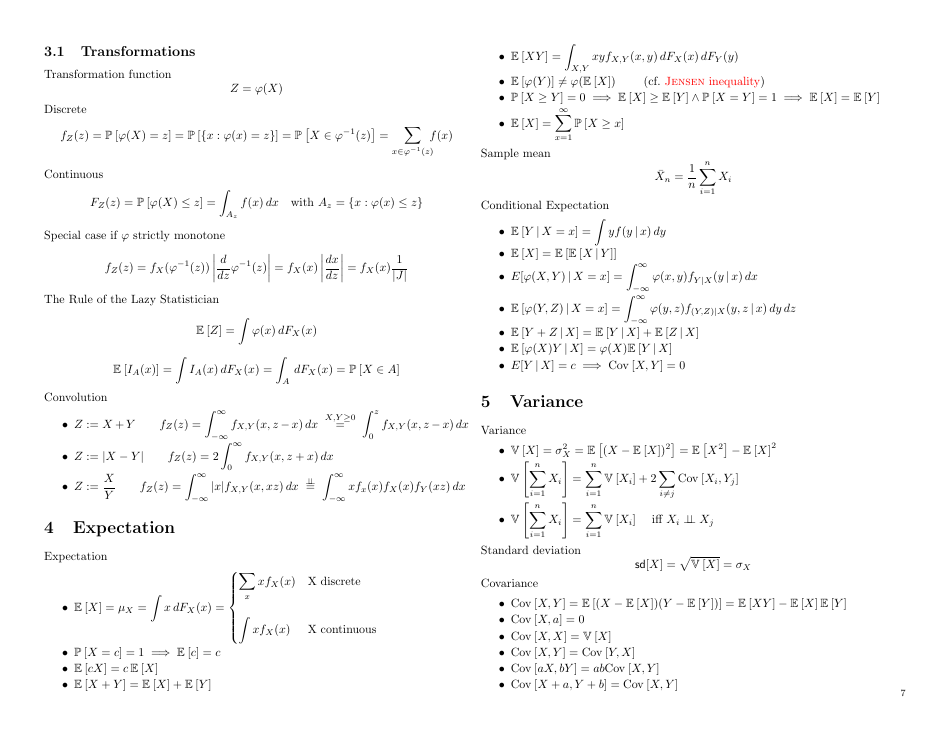
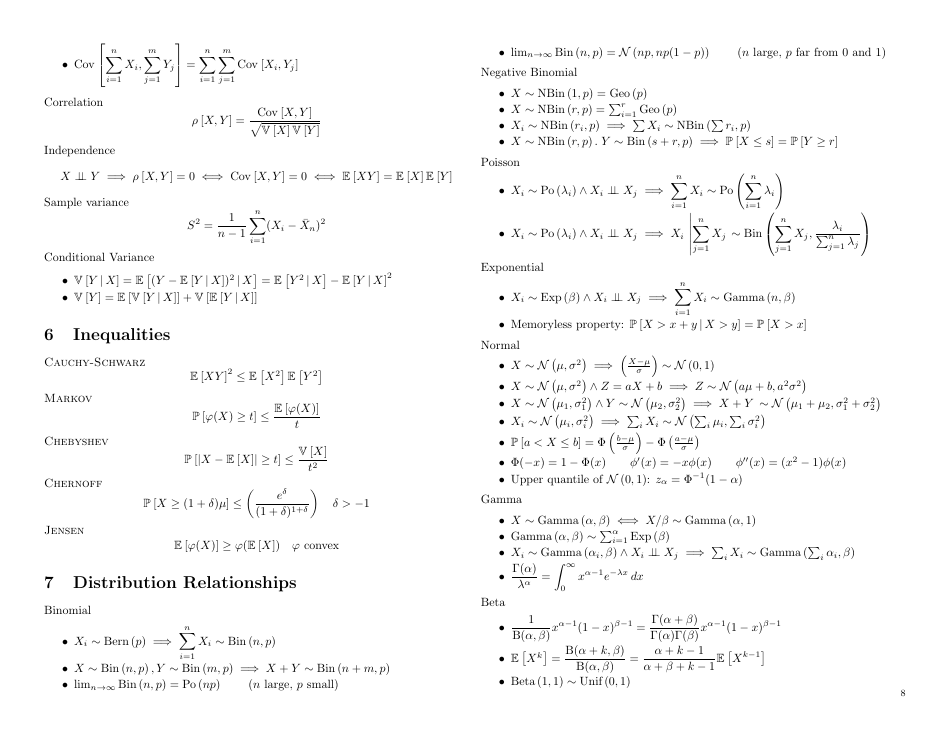
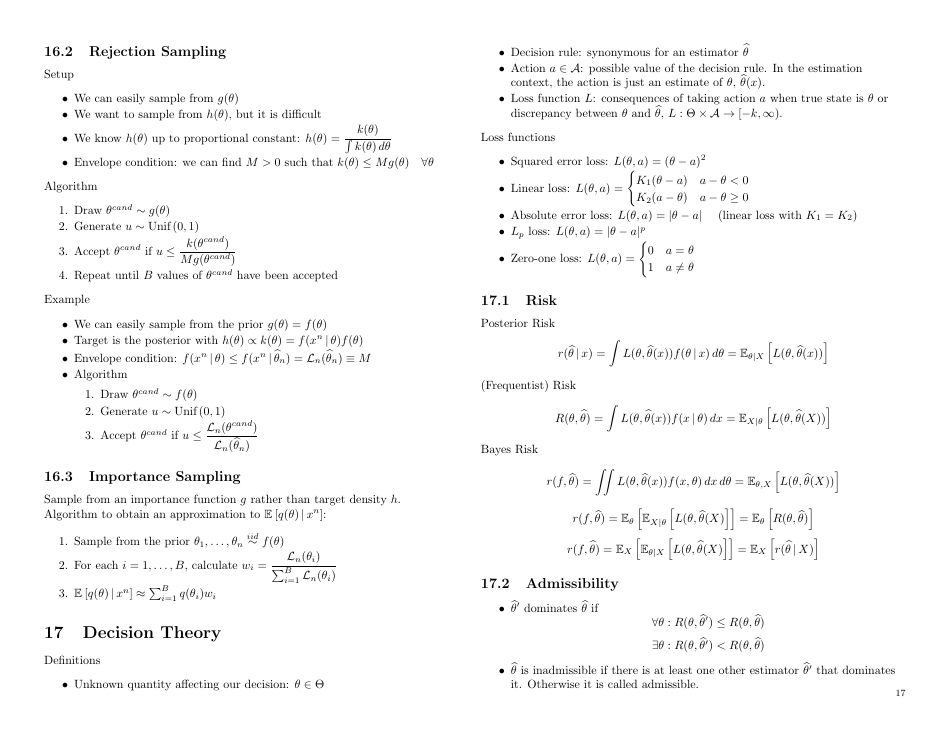
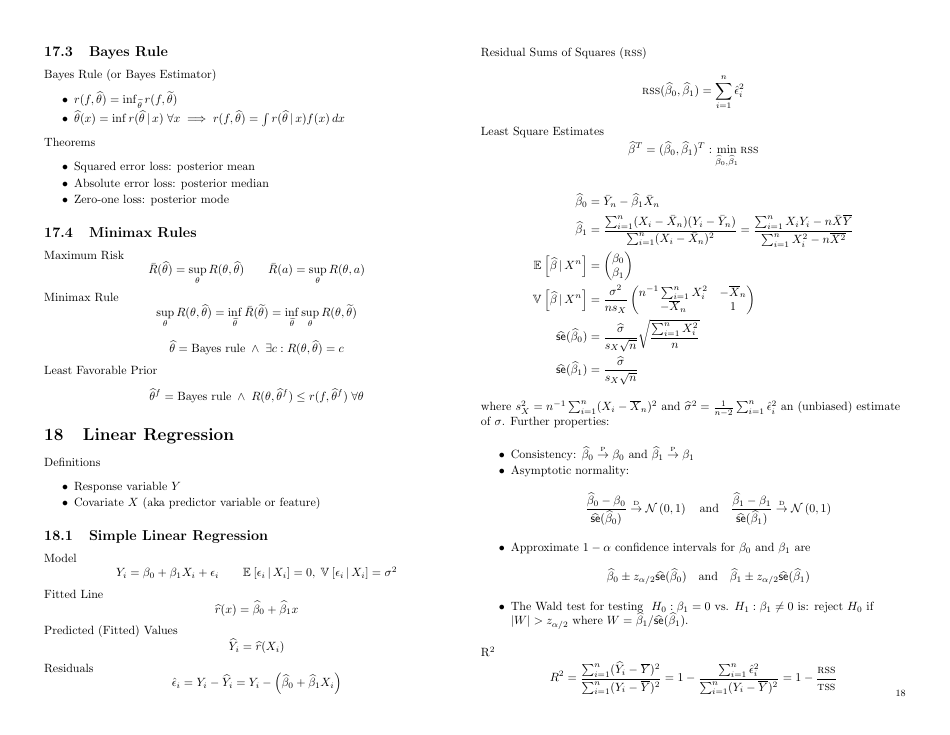
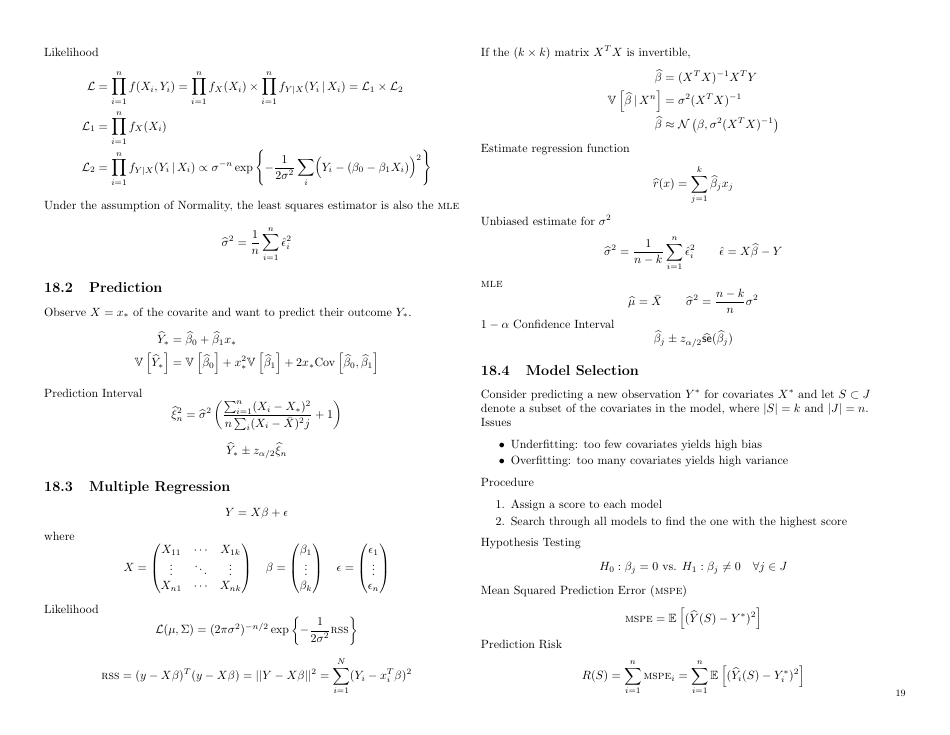
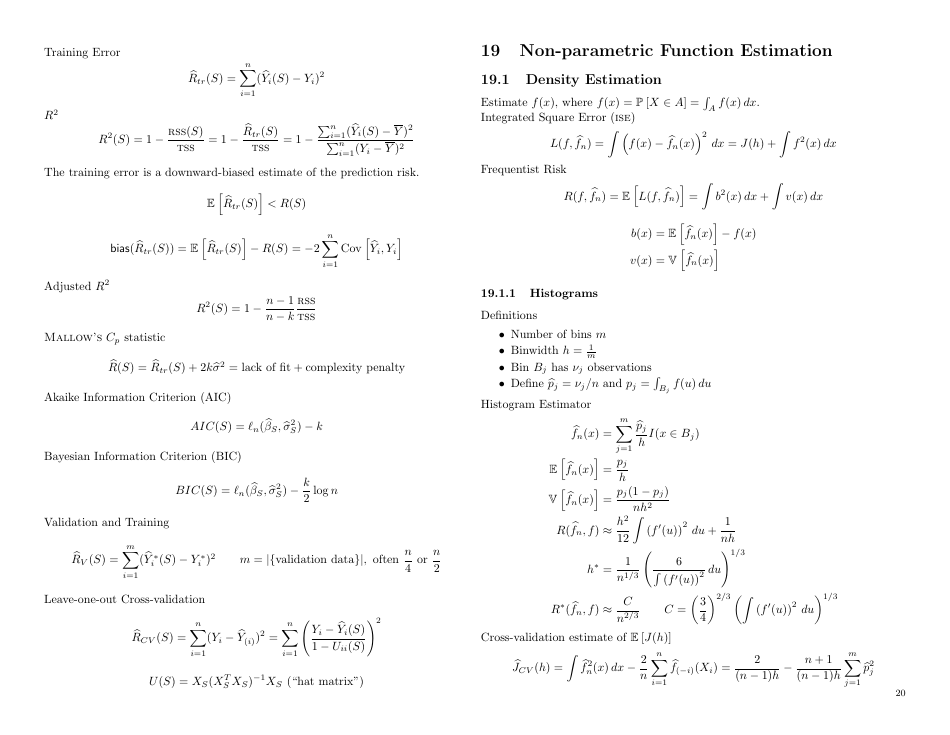
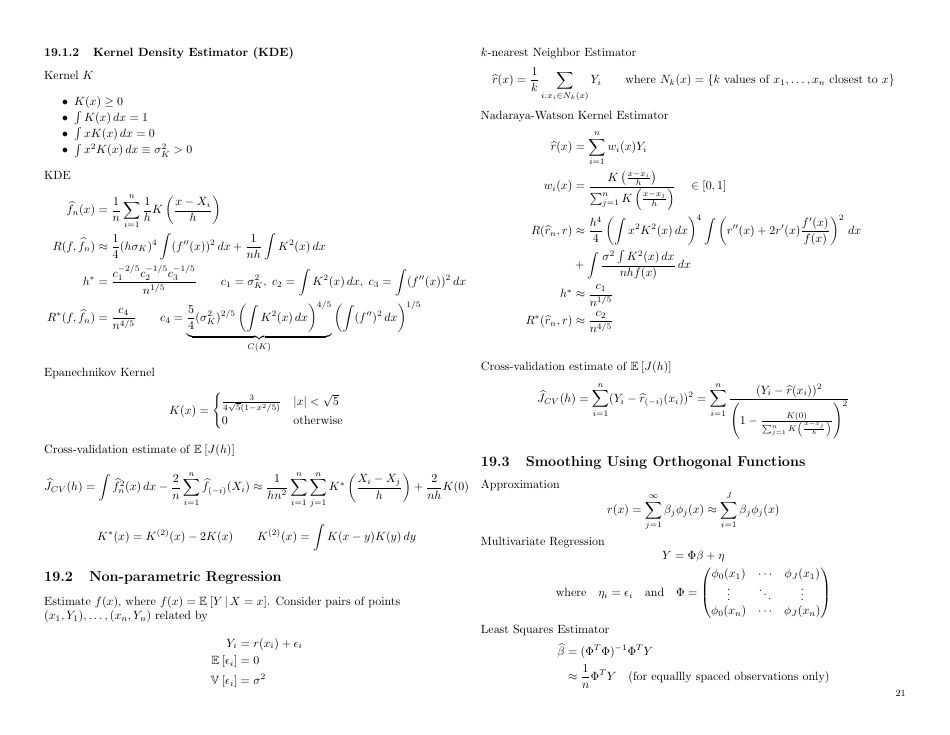
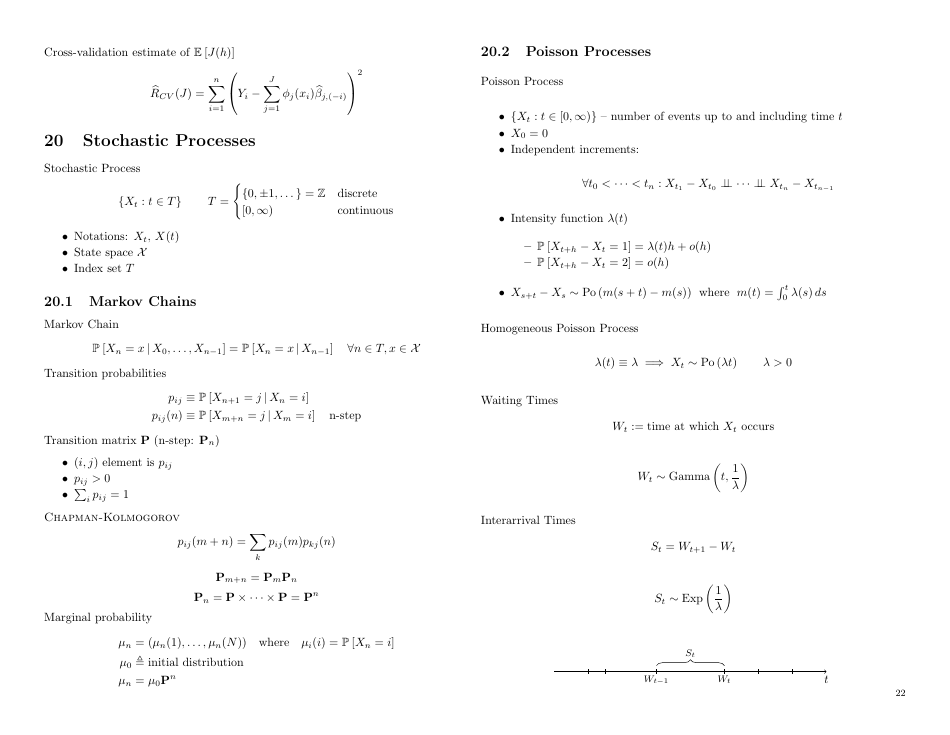
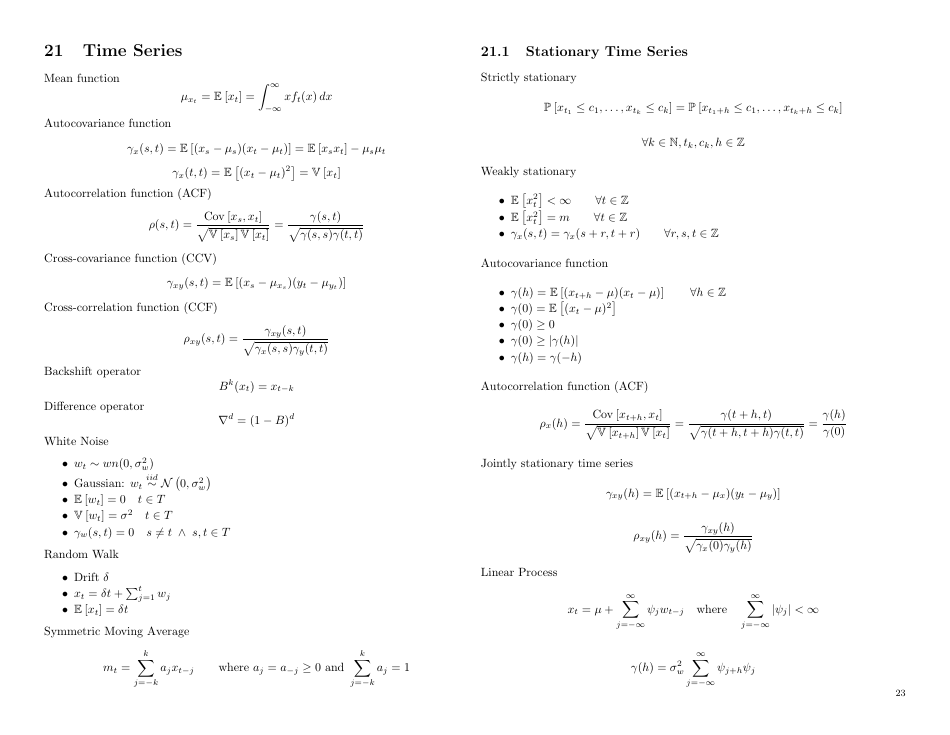
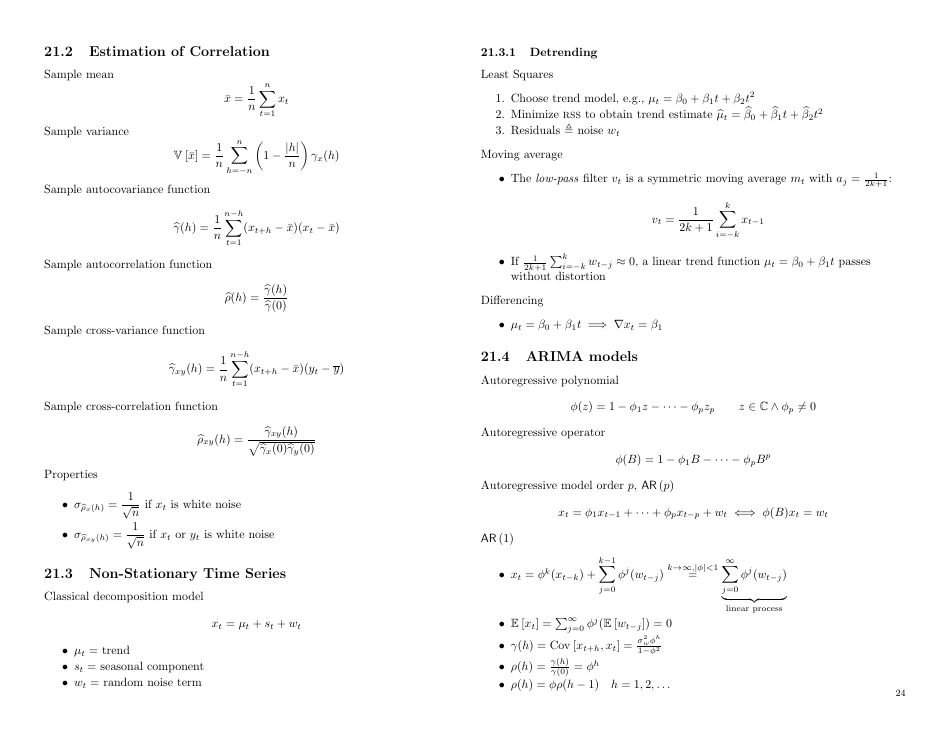
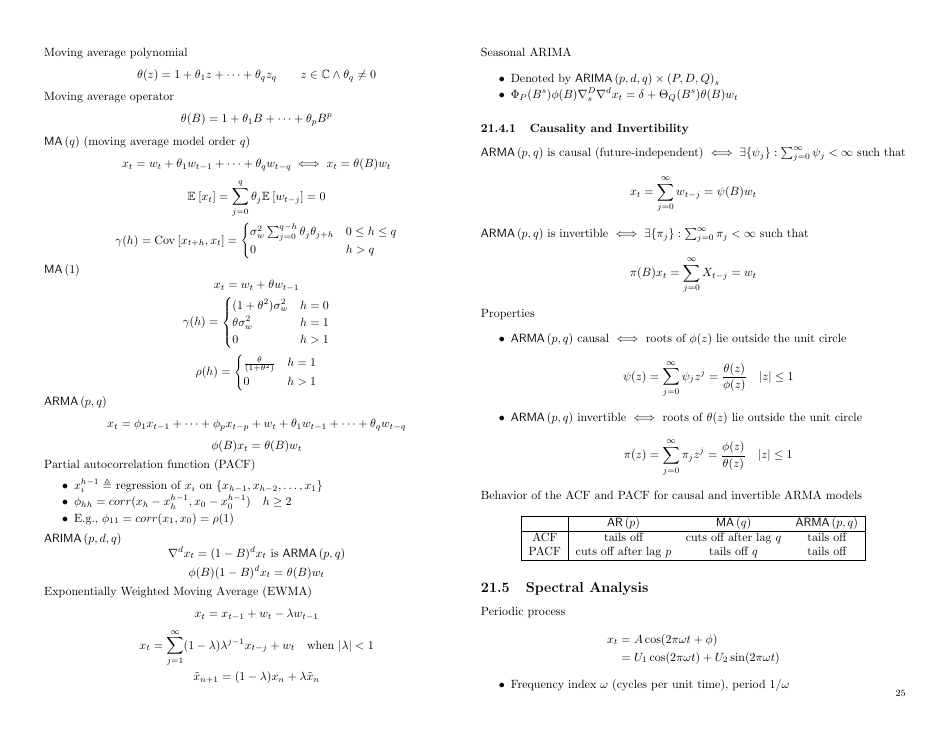
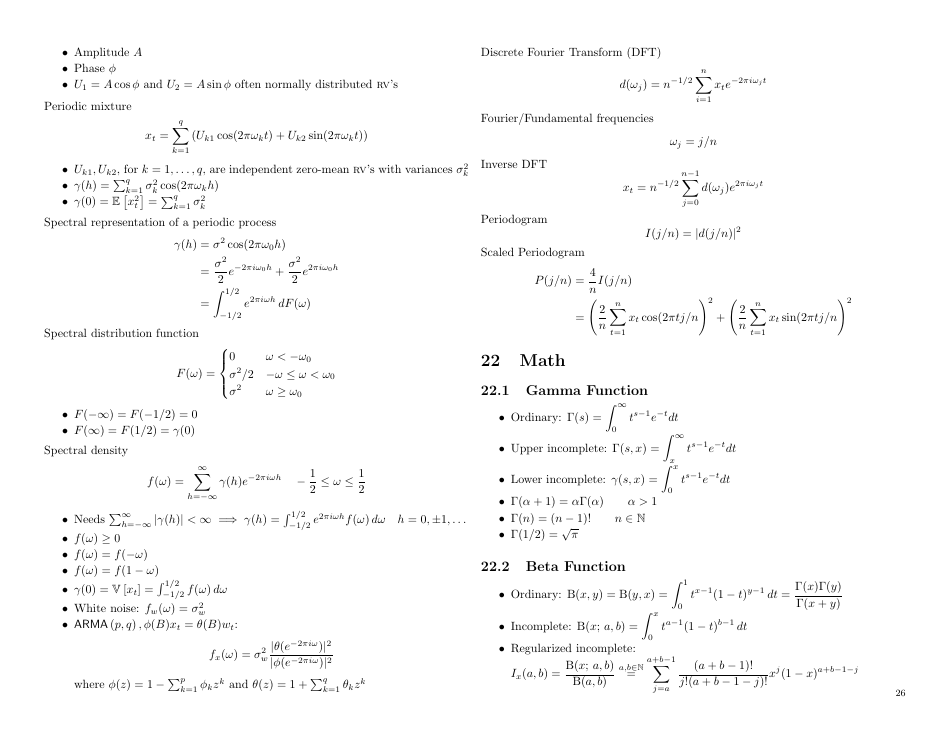
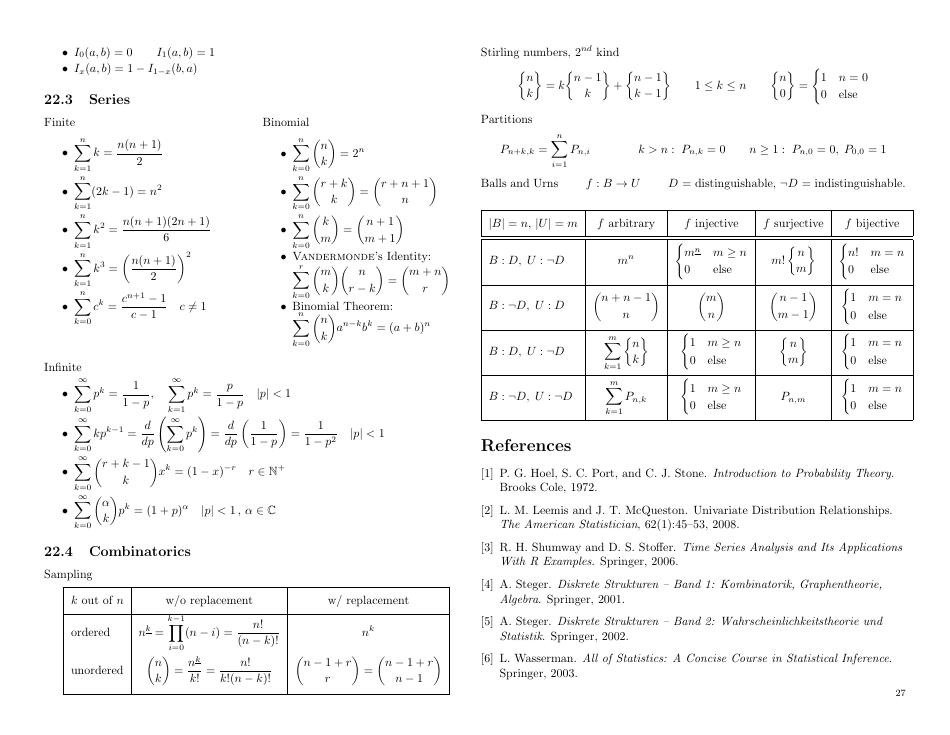
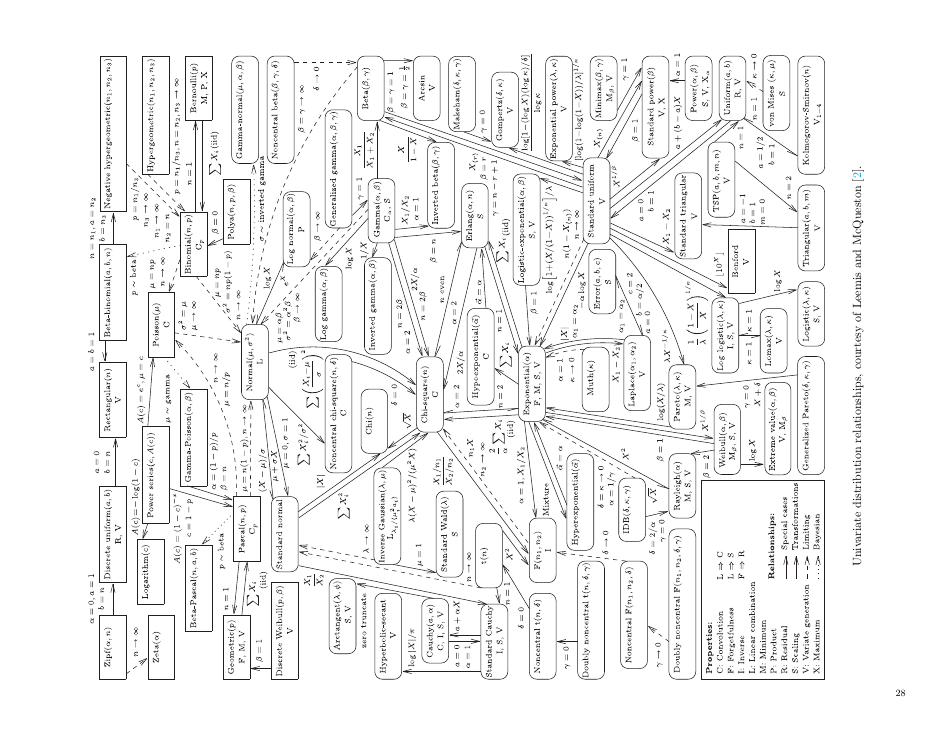
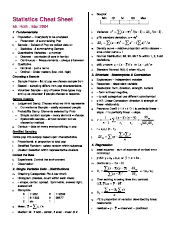
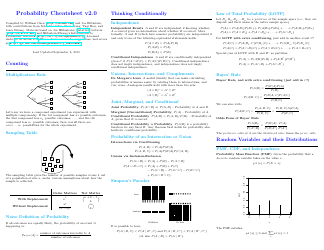
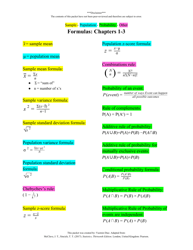
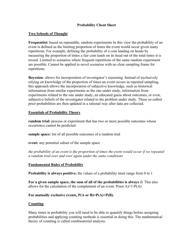
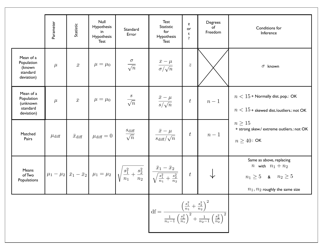
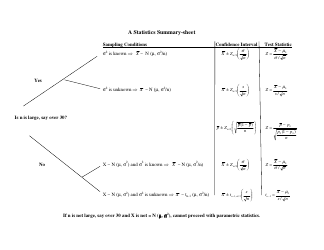
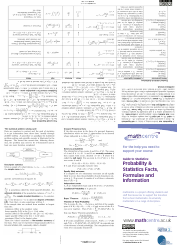
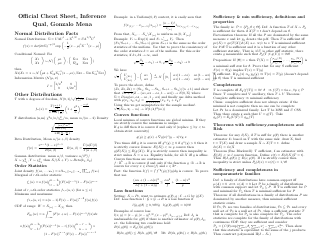
The "Probability and Statistics Cheat Sheet" by Matthias Vallentin is a resource that provides a concise summary of key concepts, formulas, and techniques used in probability and statistics. It is designed to help students and professionals quickly review and understand important topics in these fields.
FAQ
Q: What is probability?
A: Probability is the measure of the likelihood of an event occurring.
Q: What is statistics?
A: Statistics is the study of how to collect, analyze, interpret, present, and organize data.
Q: What are some common measures of central tendency?
A: Common measures of central tendency include mean, median, and mode.
Q: What is standard deviation?
A: Standard deviation measures the amount of variation or dispersion in a set of values.
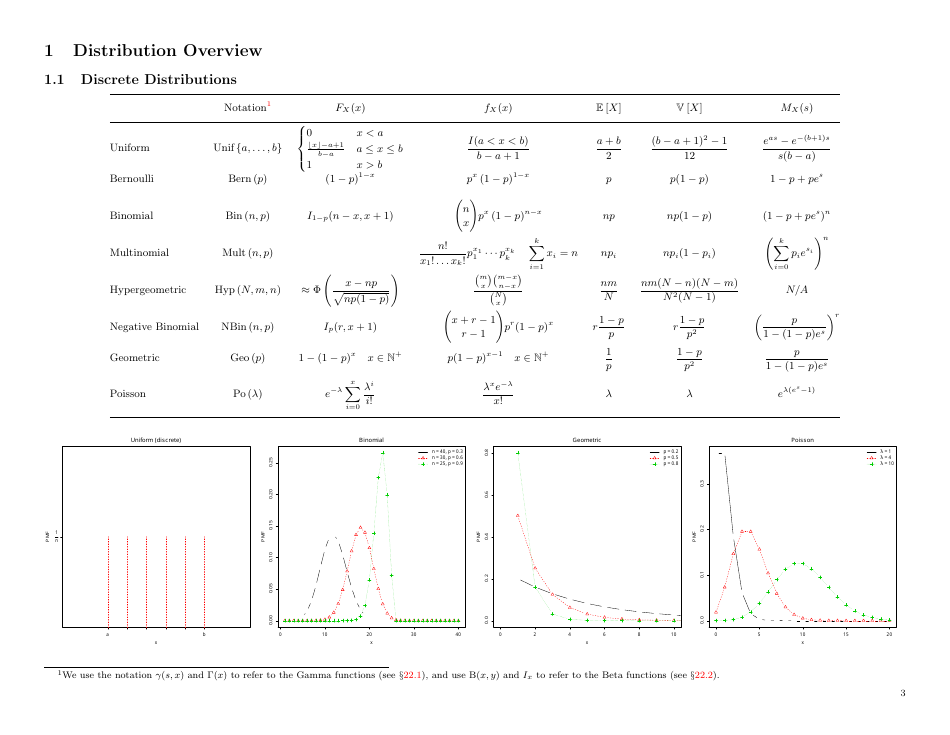
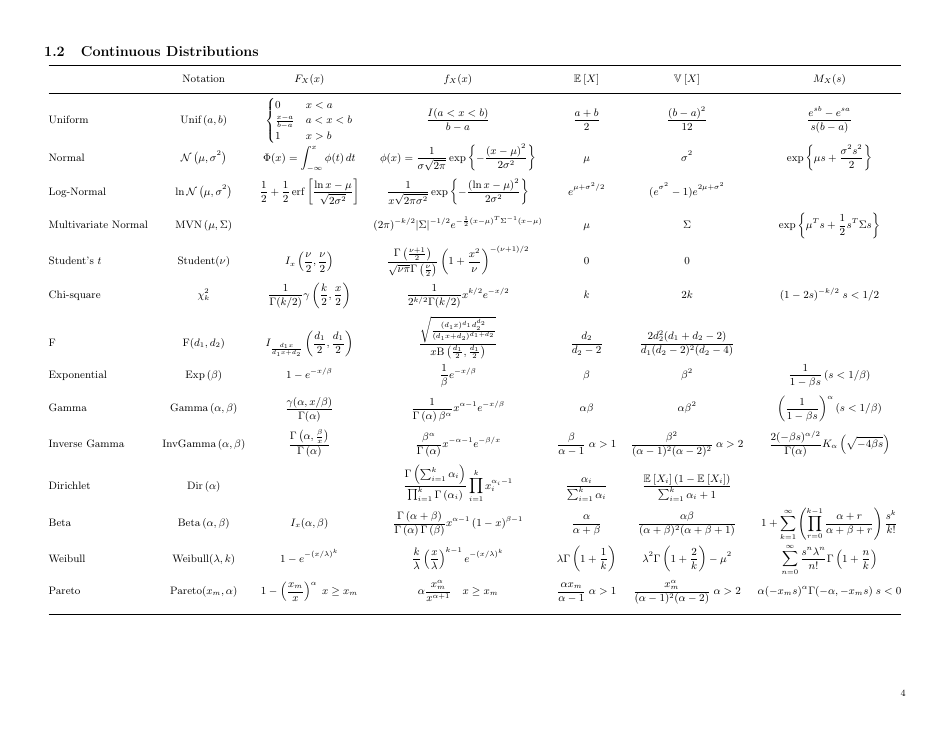
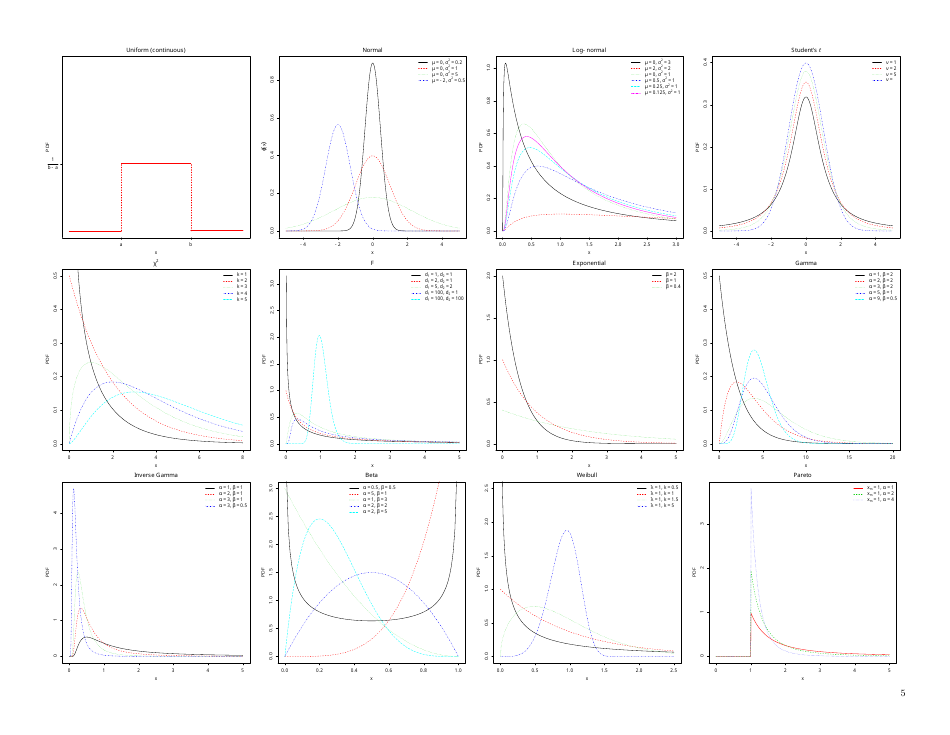
Q: What is a probability distribution?
A: A probability distribution is a function that describes the likelihood of obtaining the possible values that a random variable can take.
Q: What is a normal distribution?
A: A normal distribution, also known as a Gaussian distribution, is a continuous probability distribution that is symmetric, bell-shaped, and characterized by its mean and standard deviation.
Q: What is hypothesis testing?
A: Hypothesis testing is a statistical method used to make inferences or conclusions about a population based on a sample of data.
Q: What is linear regression?
A: Linear regression is a statistical technique used to model the relationship between a dependent variable and one or more independent variables.
Q: What is sampling?
A: Sampling is the process of selecting a subset of individuals or items from a larger population in order to study and make inferences about the population.
Q: What are confidence intervals?
A: Confidence intervals are a range of values calculated from sample data that is likely to contain the true population parameter with a certain level of confidence.
