Weight Loss Graph - Kilograms
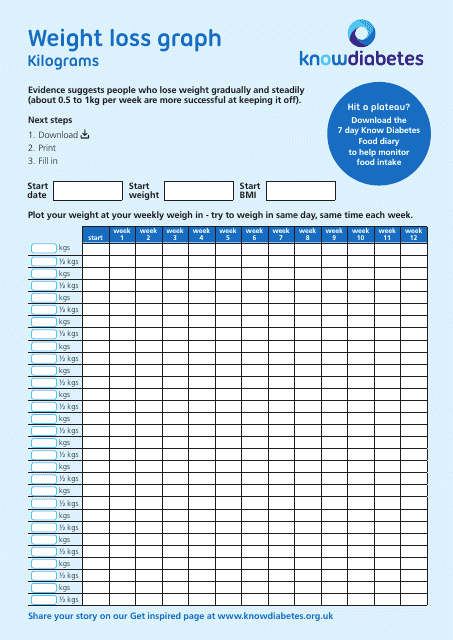
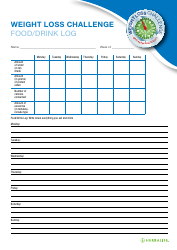
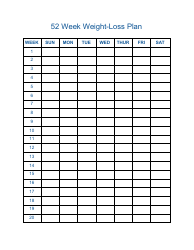
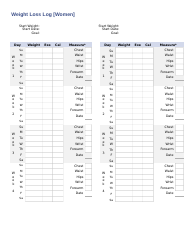
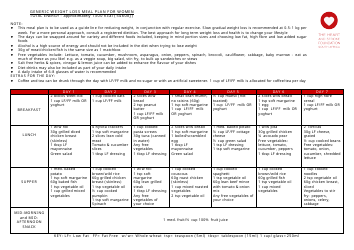
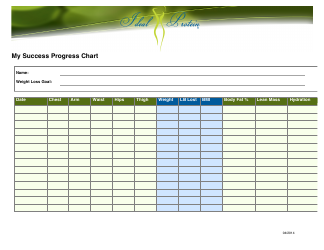
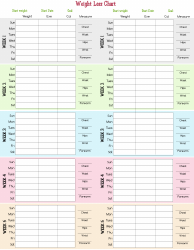
A Weight Loss Graph - Kilograms is used to track and visualize the amount of weight lost in kilograms over time.
FAQ
Q: What is a weight loss graph?
A: A weight loss graph is a graphical representation of the changes in your body weight over time.
Q: How can a weight loss graph help?
A: A weight loss graph can help track your progress and visually see the changes in your body weight.
Q: How do you create a weight loss graph?
A: To create a weight loss graph, you can use software or apps that allow you to enter your weight data and generate a graph.
Q: What is the unit of measurement for a weight loss graph?
A: The unit of measurement for a weight loss graph is usually in kilograms.
Q: Why is kilograms commonly used in weight loss graphs?
A: Kilograms are commonly used in weight loss graphs because it is the standard unit of measurement for body weight in many countries, including the US and Canada.
Q: What are the benefits of using a weight loss graph?
A: Using a weight loss graph can help you stay motivated, track your progress, and identify patterns or trends in your weight loss journey.
Q: What should I include in a weight loss graph?
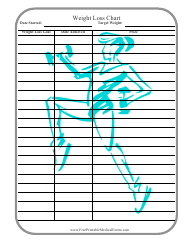
A: In a weight loss graph, you should include the dates or time periods in which you weighed yourself and the corresponding body weight.
Q: Can I use pounds instead of kilograms in a weight loss graph?
A: Yes, you can use pounds instead of kilograms in a weight loss graph if pounds are the preferred unit of measurement for you.
Q: Are weight loss graphs accurate?
A: Weight loss graphs are as accurate as the data you input. It is important to regularly weigh yourself and enter the correct measurements to ensure accuracy.
Q: Can a weight loss graph be shared with others?
A: Yes, you can share your weight loss graph with others if you want to seek support or accountability in your weight loss journey.
