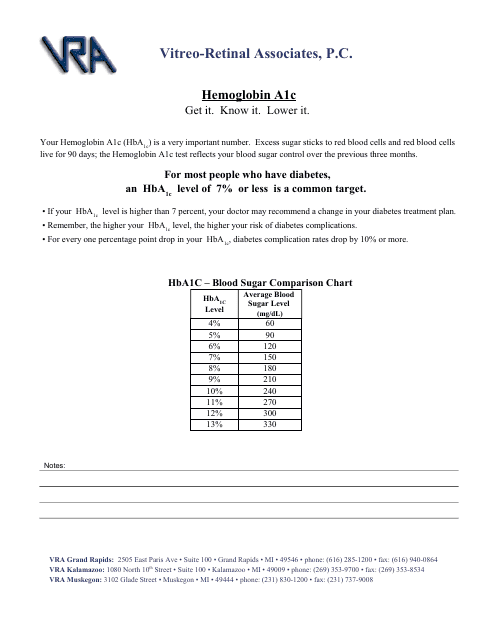
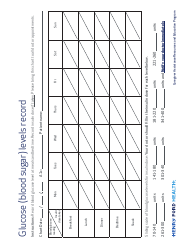
Hba1c to Blood Sugar Comparison Chart
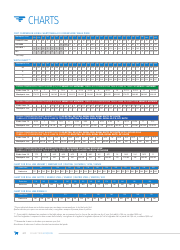
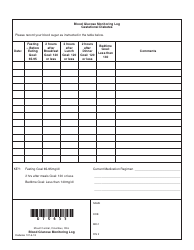
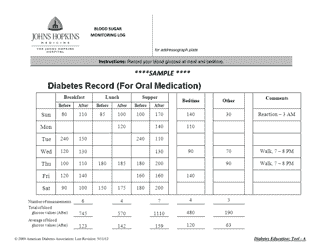
The Hba1c to Blood Sugar Comparison Chart is used to understand the relationship between Hba1c levels and average blood sugar levels over a period of time. It helps to assess and monitor diabetes management and helps healthcare professionals determine the effectiveness of treatment plans.
FAQ
Q: What is HbA1c?
A: HbA1c, or hemoglobin A1c, is a test used to measure a person's average blood sugar levels over the past 2 to 3 months.
Q: What is blood sugar?
A: Blood sugar refers to the concentration of glucose in your bloodstream.
Q: Is there a chart that compares HbA1c to blood sugar levels?
A: Yes, there are charts available that show the relationship between HbA1c levels and average blood sugar levels.
Q: How can I interpret the chart?
A: To interpret the chart, you can find your HbA1c level on the chart and see the corresponding blood sugar range.
Q: What are normal HbA1c levels?
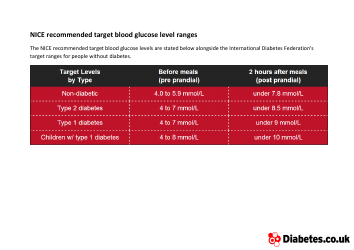
A: Normal HbA1c levels are generally below 5.7%.
Q: What are the recommended HbA1c levels for people with diabetes?
A: For people with diabetes, the recommended HbA1c levels are usually below 7%.
Q: Can the chart be used to diagnose diabetes?
A: No, the chart is not used for diagnosing diabetes. It is primarily used to monitor and manage blood sugar levels in people with diabetes.
