Graphing Quadratic Functions in Standard Form Worksheet
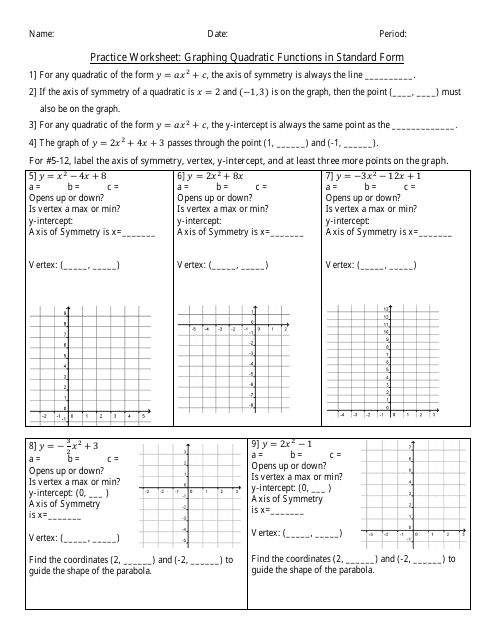
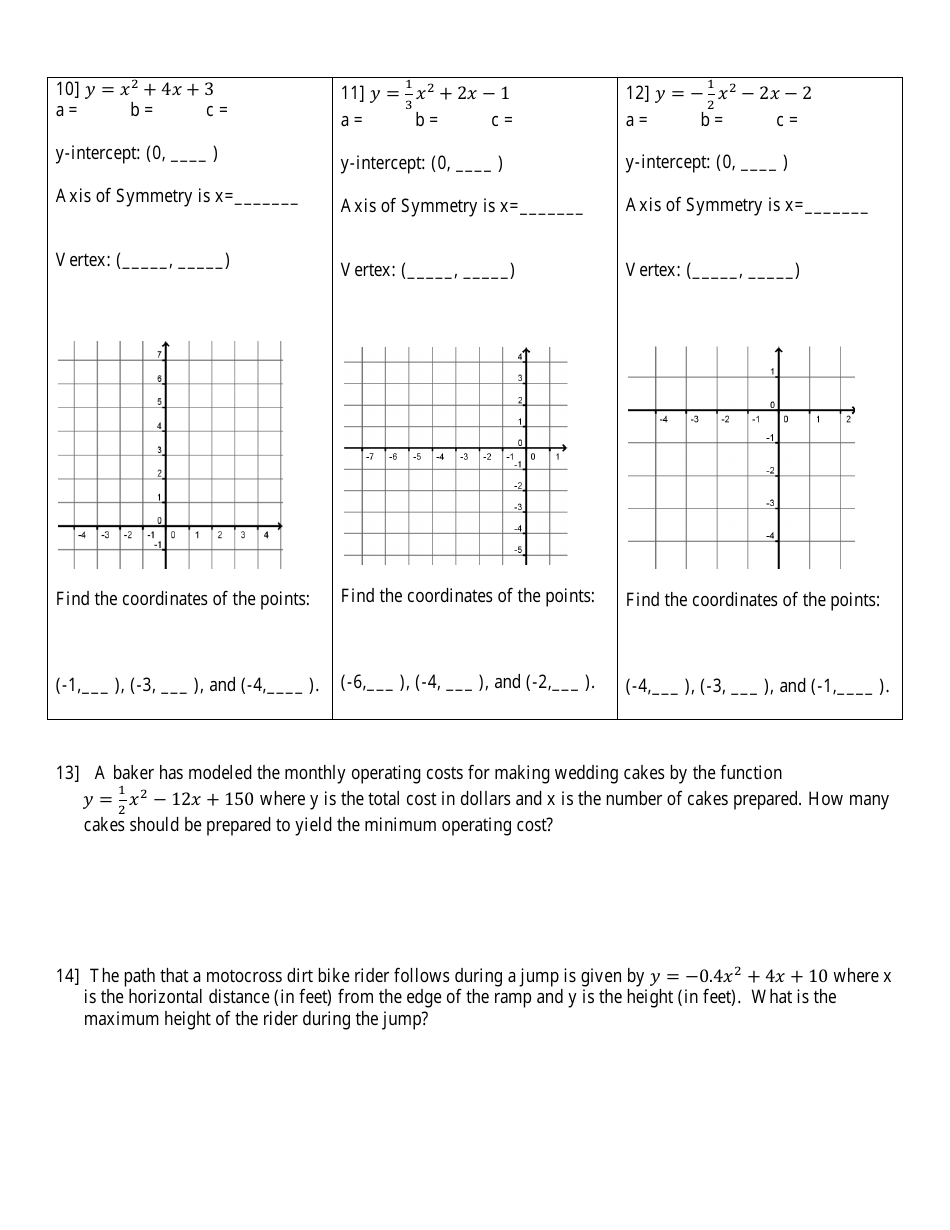
A Graphing Quadratic Functions in Standard Form worksheet is designed to help students practice graphing quadratic functions using the standard form equation. This worksheet typically includes various quadratic equations in standard form, and students are tasked with graphing the corresponding parabolas on a coordinate plane. This activity serves to reinforce the understanding of quadratic functions and their graphical representations, allowing students to become more proficient in analyzing and interpreting quadratic equations.
A graphing quadratic functions in standard form worksheet is typically filed by students or teachers in educational settings. It is not typically something that needs to be filed with any specific authority or organization outside of the school or educational institution.
FAQ
Q: What is a quadratic function in standard form?
A: A quadratic function in standard form is given by the equation f(x) = ax^2 + bx + c, where a, b, and c are constants.
Q: How do you graph a quadratic function in standard form?
A: To graph a quadratic function in standard form, follow these steps:
- Find the vertex of the parabola using the formula x = -b/(2a) and substitute the value back into the equation to find the y-coordinate.
- Identify the y-intercept by evaluating the function when x = 0.
- Determine the direction of the parabola by looking at the sign of the coefficient 'a' (positive = upward, negative = downward).
- Choose two additional points on either side of the vertex and plot them on the graph.
- Connect the points smoothly to form a parabolic curve.
Q: What properties can you identify from the standard form of a quadratic function?
A: From the standard form of a quadratic function, you can identify the following properties:
- The vertex of the parabola, which is the point (h, k) where h = -b/(2a) and k is the y-coordinate obtained by substituting h into the equation.
- The y-intercept, which is the point (0, c).
- The direction of the parabola, determined by the sign of the coefficient 'a' (upward if a > 0, downward if a < 0).
- The axis of symmetry, which is the vertical line x = h.
Q: How do you find the vertex and axis of symmetry of a quadratic function in standard form?
A: To find the vertex and axis of symmetry of a quadratic function in standard form, use the formula x = -b/(2a) to find the x-coordinate of the vertex. Substitute this value back into the equation to find the y-coordinate. The vertex is then given by the point (h, k), where h is the x-coordinate and k is the y-coordinate. The axis of symmetry is the vertical line x = h.
Q: Can you provide an example of graphing a quadratic function in standard form?
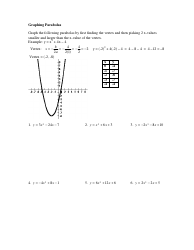
A: Sure! Let's graph the function f(x) = x^2 - 4x + 3:
- Find the vertex: x = -(-4)/(2*1) = 2. Substitute x = 2 into the equation: f(2) = (2)^2 - 4(2) + 3 = 4 - 8 + 3 = -1. So, the vertex is (2, -1).
- Identify the y-intercept: When x = 0, f(x) = (0)^2 - 4(0) + 3 = 3. So, the y-intercept is (0, 3).
- Determine the direction: In this case, the coefficient of x^2 is positive, so the parabola opens upward.
- Choose additional points: Let's use x = 1 and x = 3. When x = 1, f(x) = (1)^2 - 4(1) + 3 = 0. And when x = 3, f(x) = (3)^2 - 4(3) + 3 = 0. So, the additional points are (1, 0) and (3, 0).
- Connect the points: Plot the vertex, y-intercept, and additional points on the graph and connect them smoothly to form a parabolic curve.
