Garden Creatures Bar Graph Worksheet With Answer Key
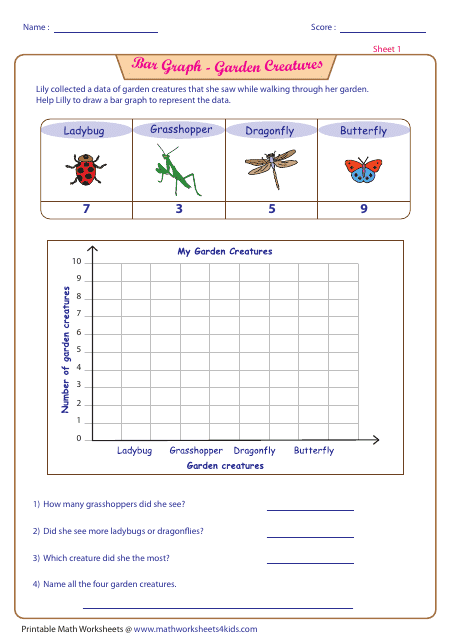
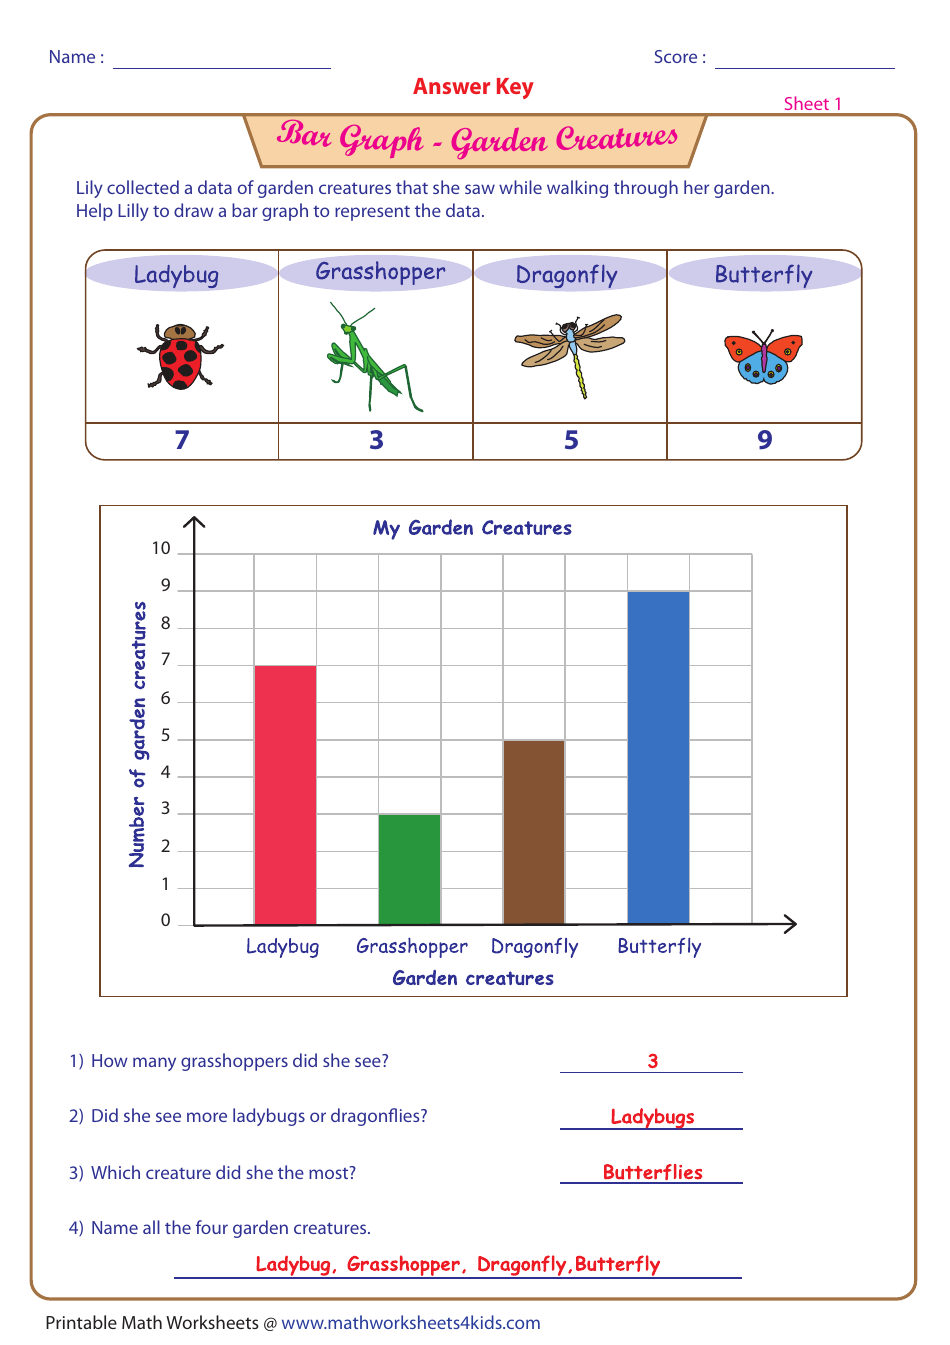
The Garden Creatures Bar Graph Worksheet With Answer Key is a resource used to help students practice interpreting data and creating bar graphs. It provides a visual representation of different garden creatures and their populations, along with an answer key for reference. It helps students develop skills in data analysis and graphing.
FAQ
Q: What is a bar graph?
A: A bar graph is a graph that uses rectangular bars to represent data.
Q: What is the purpose of a bar graph?
A: The purpose of a bar graph is to visually compare different categories or groups.
Q: What information does the Garden Creatures Bar Graph show?
A: The Garden Creatures Bar Graph shows the number of different garden creatures found in a garden.
Q: How are the garden creatures represented in the bar graph?
A: The garden creatures are represented by the height of the bars in the graph.
Q: What is the vertical axis of the bar graph?
A: The vertical axis of the bar graph represents the number of garden creatures.
Q: What is the horizontal axis of the bar graph?
A: The horizontal axis of the bar graph represents the different types of garden creatures.
Q: What does each bar in the graph represent?
A: Each bar in the graph represents a different type of garden creature.
Q: How can you interpret the bar graph?
A: You can interpret the bar graph by comparing the heights of the bars to determine which garden creatures are more prevalent.
Q: How many butterflies were found in the garden?
A: The number of butterflies found in the garden can be determined by looking at the height of the butterfly bar in the graph.
Q: Which garden creature is the most prevalent?
A: The most prevalent garden creature can be determined by identifying the bar with the greatest height in the graph.
