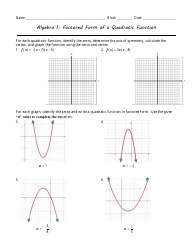
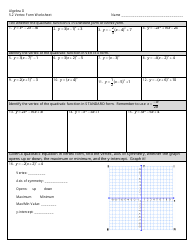
Investigating Graphs of Quadratic Equations Using Desmos Worksheet (Vertex Form)
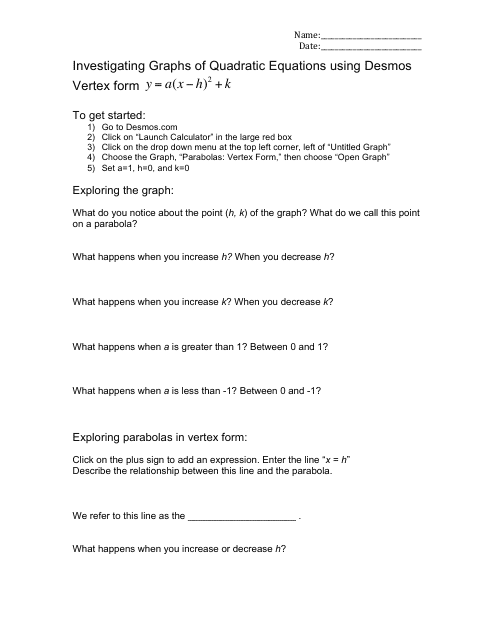
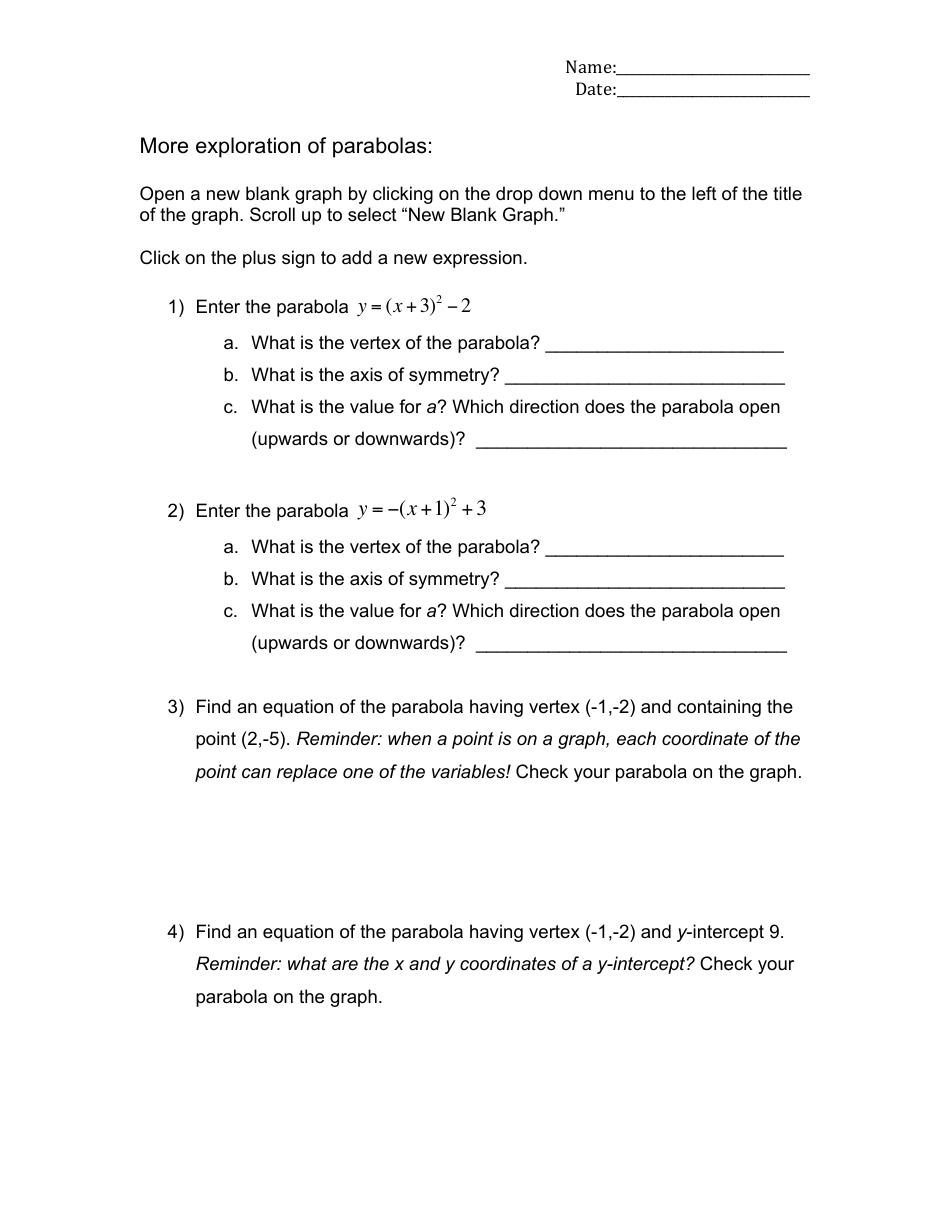
The worksheet "Investigating Graphs of Quadratic Equations Using Desmos (Vertex Form)" is used for exploring and understanding the graphs of quadratic equations in the vertex form. It helps students analyze the key features of these graphs, such as the vertex, axis of symmetry, and whether the parabola opens upward or downward. By using the Desmos graphing calculator, students can visually see how different values in the equation affect the shape and position of the graph.
FAQ
Q: What is vertex form in a quadratic equation?
A: Vertex form is a way to write a quadratic equation, expressed as y = a(x-h)^2 + k, where (h, k) represents the vertex of the parabola.
Q: Why would I use Desmos to investigate graphs of quadratic equations?
A: Desmos provides a visual representation of the graph, allowing you to examine the effects of changing values of a, h, and k on the shape and position of the quadratic curve.
Q: How can I use Desmos to graph a quadratic equation in vertex form?
A: You can enter the equation in the Desmos calculator using the vertex form, and it will plot the graph accordingly. You can also adjust the values of a, h, and k to see the changes in the graph.
Q: What can I learn by investigating graphs of quadratic equations using Desmos?
A: By analyzing the graph, you can understand the nature of the parabola (whether it opens upward or downward), the location of the vertex, the axis of symmetry, and the behavior of the graph as a, h, and k change.
Q: Can I use Desmos to find the roots of a quadratic equation?
A: Yes, Desmos can also find the x-intercepts (or roots) of a quadratic equation by setting y=0 and using the intersection feature on the graph.
