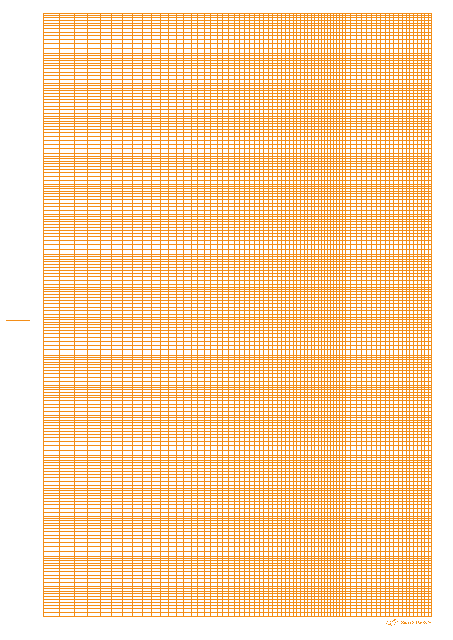
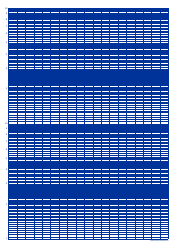
Orange Logarithmic Graph Paper Template - 6 Decades
The Orange Logarithmic Graph Paper Template - 6 Decades is primarily used for plotting data that covers a wide range of values, such as exponential growth or decay. It allows for easier visualization and analysis of such data.
FAQ
Q: What is an Orange Logarithmic Graph Paper Template?
A: Orange Logarithmic Graph Paper Template is a type of graph paper that is used for plotting data on a logarithmic scale.
Q: What is the purpose of using Orange Logarithmic Graph Paper?
A: The purpose of using Orange Logarithmic Graph Paper is to visually represent data that spans a wide range of values, making it easier to analyze and interpret.
Q: What is the color of the Orange Logarithmic Graph Paper Template?
A: The color of the Orange Logarithmic Graph Paper Template is orange.
Q: What does '6 Decades' mean in the context of Orange Logarithmic Graph Paper Template?
A: '6 Decades' refers to the logarithmic scale range covered by the graph paper, which spans across a range of 10^0 to 10^6.
Q: How can I use Orange Logarithmic Graph Paper Template?
A: You can use Orange Logarithmic Graph Paper Template by plotting your data points according to their respective logarithmic values on the graph paper.
Q: Can I print Orange Logarithmic Graph Paper Template?
A: Yes, you can print Orange Logarithmic Graph Paper Template using a printer and the appropriate graph paper template file.
Q: What are the benefits of using Orange Logarithmic Graph Paper Template?
A: The benefits of using Orange Logarithmic Graph Paper Template include better visualization of data that spans multiple orders of magnitude and easier interpretation of data trends.
Q: Is Orange Logarithmic Graph Paper Template commonly used?
A: Orange Logarithmic Graph Paper Template is not as commonly used as regular linear scale graph paper, but it is often used in scientific and engineering fields where data analysis involves a wide range of values.
