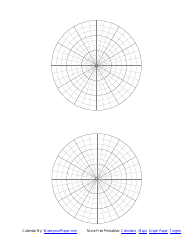
Polar Graph Paper - Black and Grey
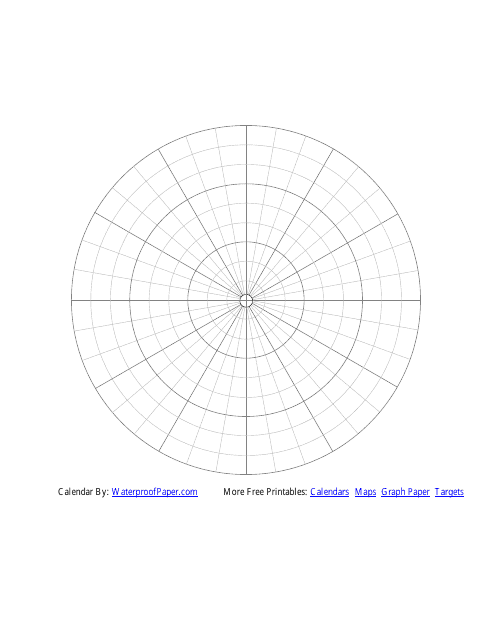
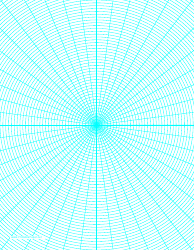
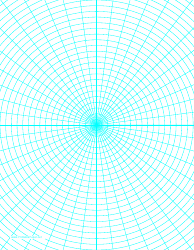
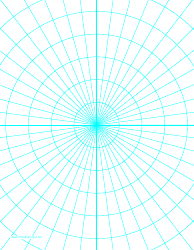
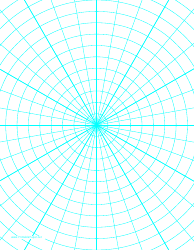
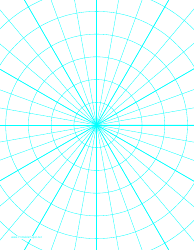
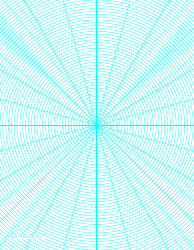
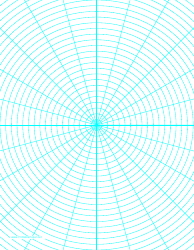
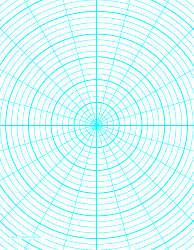
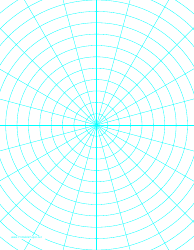
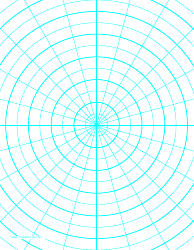
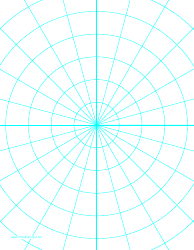
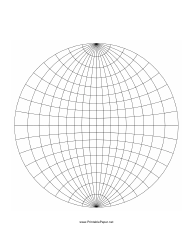
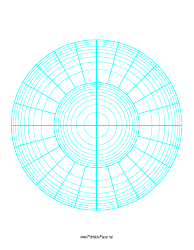
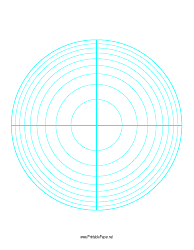
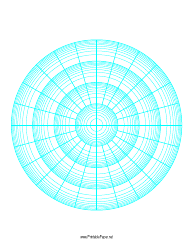
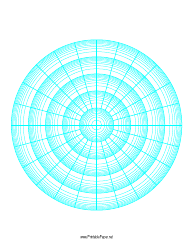
Polar Graph Paper - Black and Grey is typically used for graphing polar coordinates, which are pairs of values that represent distances and angles. In the world of mathematics and engineering, this type of graph paper plays a crucial role in creating precise and detailed plots. The concentric circles represent distance from the point of origin, while the ray, or the 'spoke', represents the angle in degrees. The black and grey color scheme provides clear visibility to distinguish between different plots or marks, which helps to facilitate more accurate calculations. This graph paper is especially useful in fields like engineering, architecture, physics, and more, where complex measurements and geometric calculations are involved.
The Polar Graph Paper - Black and Grey is typically filed by mathematicians, engineers, architects, or students studying these subjects. These groups use the paper for functions and equations in polar coordinate systems. It's not specific to any country and can be utilized globally. If it's an official document, it may be filed by the individual or organization that made use of it.
FAQ
Q: What is polar graph paper?
A: Polar graph paper is a type of graph paper that is used specifically for plotting polar coordinates. It is a grid with concentric circles, each representing different radii, divided into small arcs or 'pie wedges' to allow plotting in polar coordinates.
Q: What is the use of polar graph paper?
A: Polar graph paper is commonly used in mathematics, physics, engineering, and navigation to represent directions or orientations, express complex numbers, graph trigonometric functions, or depict circular motion.
Q: What does the black and grey mean on polar graph paper?
A: Black and grey colors on a polar graph paper are usually used to differentiate between the lines on the graph. For instance, black might depict the division lines, while grey could be used for the concentric circles.
Q: Is there any mathematical software that provides polar graph paper?
A: Many mathematical software programs, such as MatLab, Mathematica, or Geogebra, offer options for plotting data in polar coordinates, effectively providing a digital version of polar graph paper.
