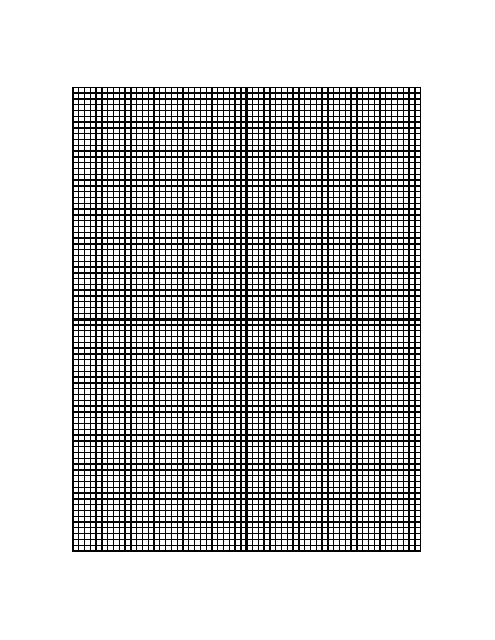
10 Lines / Inch Graph Paper With Centered X-Y Axis
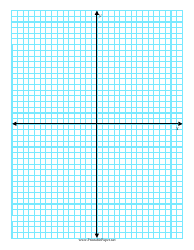
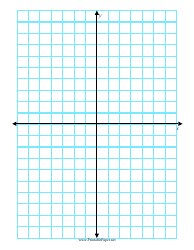
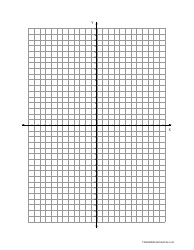
10 Lines/Inch Graph Paper With Centered X-Y Axis is commonly used in graphing, algebra, and geometry. The paper features a grid that consists of horizontal and vertical lines spaced every 1/10 inch, making it perfect for plotting graphs with high precision. The centered X-Y axis represents the horizontal (X) and vertical (Y) guides, effectively dividing the graph paper into four quadrants and allowing the user to plot both positive and negative values. This type of graph paper is often used by students, engineers, architects, and scientists for tasks such as creating charts, designing projects, depicting mathematical functions, and analyzing data streams. It is especially beneficial for those needing to plot out detailed, precision-based graphs.
The 10 Lines/Inch Graph Paper with Centered X-Y Axis is not necessarily filed by a specific person or a specific job role. It's a type of graph paper that is used across various professions and industries. Students, engineers, designers, architects or anyone who needs to create a diagram, graph, chart or similar visual representation could potentially be using this type of graph paper. It is not a document that has to be "filed" in a formal sense like a legal or tax document. Instead, it's a physical or digital tool that individuals use for visualizing and plotting data accurately.
FAQ
Q: What is 10 lines/inch graph paper with a centered X-Y axis?
A: A 10 lines/inch graph paper with a centered X-Y Axis is a type of graph paper that consists of 10 lines per inch. The graph is divided into four quadrants by a horizontal (X-axis) and a vertical (Y-axis) line which crosses at the center.
Q: In what fields is 10 lines/inch graph paper with centered X-Y Axis commonly used?
A: This type of graph paper is commonly used in mathematics, engineering, science-related fields or any other area which involves creating or interpreting graphs and charts.
Q: What are the advantages of using a 10 lines/inch graph paper with a centered X-Y axis?
A: The 10 lines/inch graph paper with a centered X-Y axis provides more detailed results, improves the accuracy of drawn figures, and allows for more precise measurements. It also aids in better visualization of data.
Q: What programs can generate a 10 lines/inch graph paper with a centered X-Y Axis?
A: Various software like Microsoft Excel, Google Sheets or specialized graphing software can be used to generate a 10 lines/inch graph paper with a centered X-Y Axis.
Q: What is the size of each square on a 10 lines/inch graph paper?
A: Each square on a 10 lines/inch graph paper is 0.1 inch by 0.1 inch.
Q: How does a centered X-Y axis help in plotting graphs?
A: A centered X-Y axis, dividing the paper into four quadrants, allows for plotting data in positive and negative values on both the X-axis (horizontal) and Y-axis (vertical).
Q: Can 10 lines/inch graph paper with a centered X-Y Axis be used for 3D plotting?
A: 3D plotting requires an additional axis, Z-axis. Standard 2D graph paper can’t accommodate this. However, you can visualize the 3D plot in 2D using techniques like projection or contouring on a 10 lines/inch graph paper.
