Thermometer Goal Chart Template - Balance
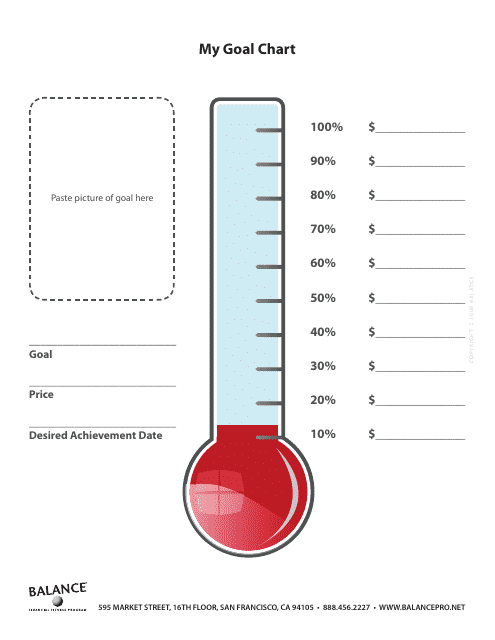
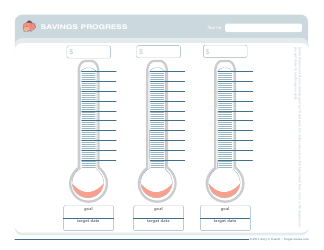
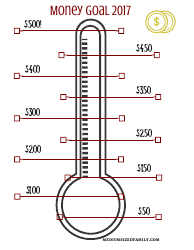
The Thermometer Goal Chart Template - Balance is a visual tool used to track progress towards a specific goal. It helps to visually represent the progress made towards achieving the goal, similar to a thermometer filling up as more progress is made.
FAQ
Q: What is a thermometer goal chart?
A: A thermometer goal chart is a visual representation of progress towards a specific goal or target.
Q: How does a thermometer goal chart work?
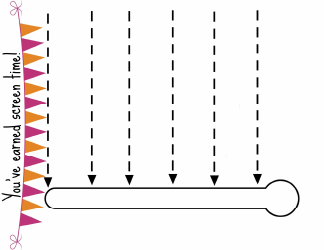
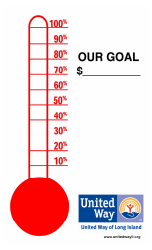
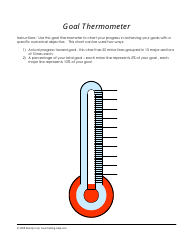
A: A thermometer goal chart typically has a thermometer shape where the progress is tracked by coloring in or filling up the thermometer as you make progress towards your goal.
Q: What is the purpose of a thermometer goal chart?
A: The purpose of a thermometer goal chart is to provide a visual motivation and clear tracking of progress towards a goal. It helps to create a sense of achievement as the thermometer fills up.
Q: Why is it called a thermometer goal chart?
A: It is called a thermometer goal chart because the shape resembles a thermometer, and the progress is shown by filling up the thermometer, much like the rising temperature.
Q: What types of goals can be tracked using a thermometer goal chart?
A: A thermometer goal chart can be used to track financial goals, fundraising goals, savings goals, weight loss goals, or any other measurable goal that can be represented visually.
Q: How can I create a thermometer goal chart?
A: You can create a thermometer goal chart using a template or by drawing a thermometer shape on paper or a whiteboard. Label the chart with your goal, and color in or fill up the thermometer as you make progress towards your goal.
