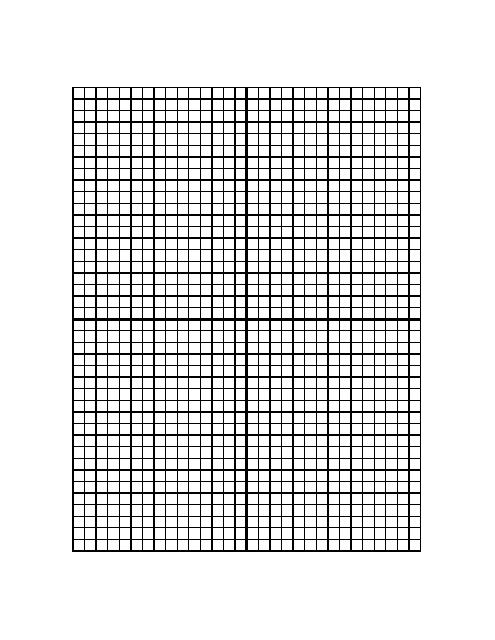
Graph Paper With Centered Xy Axis - 5 Lines / Inch
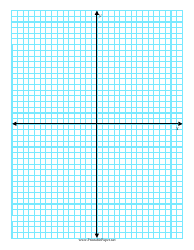
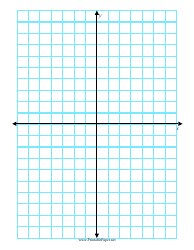
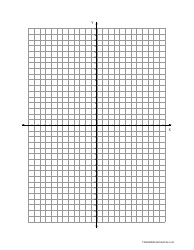
Graph paper with centered X-Y axis - 5 lines/inch is typically used for various mathematical and scientific calculations. It's especially beneficial for graphing equations or drawing graphs in subjects like algebra, calculus, and geometry. The centered X-Y axis provides a point of origin for the graph (0,0) which is crucial for graphing both positive and negative values. Furthermore, the 5 lines/inch provides a scale or reference points to ensure measurements, and plotted points are accurate. This type of graph paper can also be utilized in various fields such as engineering, architecture, and physics.
The Graph Paper with Centered XY Axis - 5 lines/inch can be filed by individuals or institutions, such as schools or universities, from various fields who require documented graphical data. This includes mathematicians, engineers, designers, architects, and students using such graphs. The filing process isn't specific to the USA, Canada, India, or Australia, but is generally universal. Please note that documents are filed according to the specific organizational system of the entity that holds them.
FAQ
Q: What is Graph Paper With Centered Xy Axis - 5 Lines/Inch?
A: This is a type of graph paper that has an XY axis placed in the center of the paper, and the grid is made up of 5 lines per inch. It is usually used in mathematics or engineering to plot data points on a two-dimensional plane.
Q: How to use Graph Paper With Centered Xy Axis - 5 Lines/Inch?
A: To use this type of graph paper, you simply plot your data points onto the paper using the XY axis as your reference. The scale is 5 lines per inch, so each line counts as a specific value margin.
Q: What fields commonly use Graph Paper With Centered Xy Axis - 5 Lines/Inch?
A: Graph papers with a centered XY axis - 5 lines/inch are commonly used in fields that require precise charting or plotting of data like mathematics, engineering, architecture, physics, and other sciences.
Q: Why is the XY axis centered in this kind of graph paper?
A: The XY axis is centered in this type of graph paper to enable the user to plot data points in all four quadrants of the graph. This is particularly helpful when working with positive and negative values.
