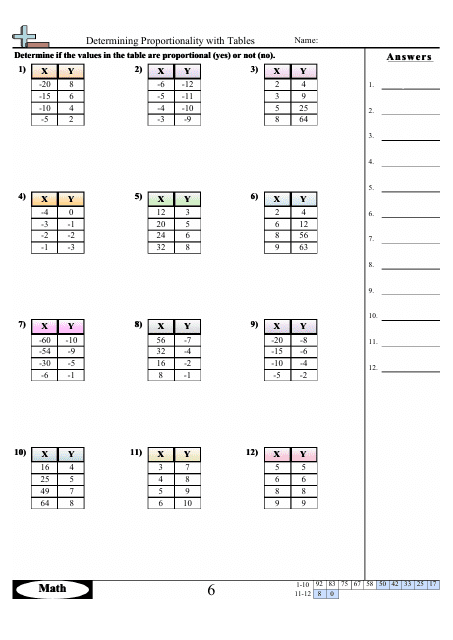
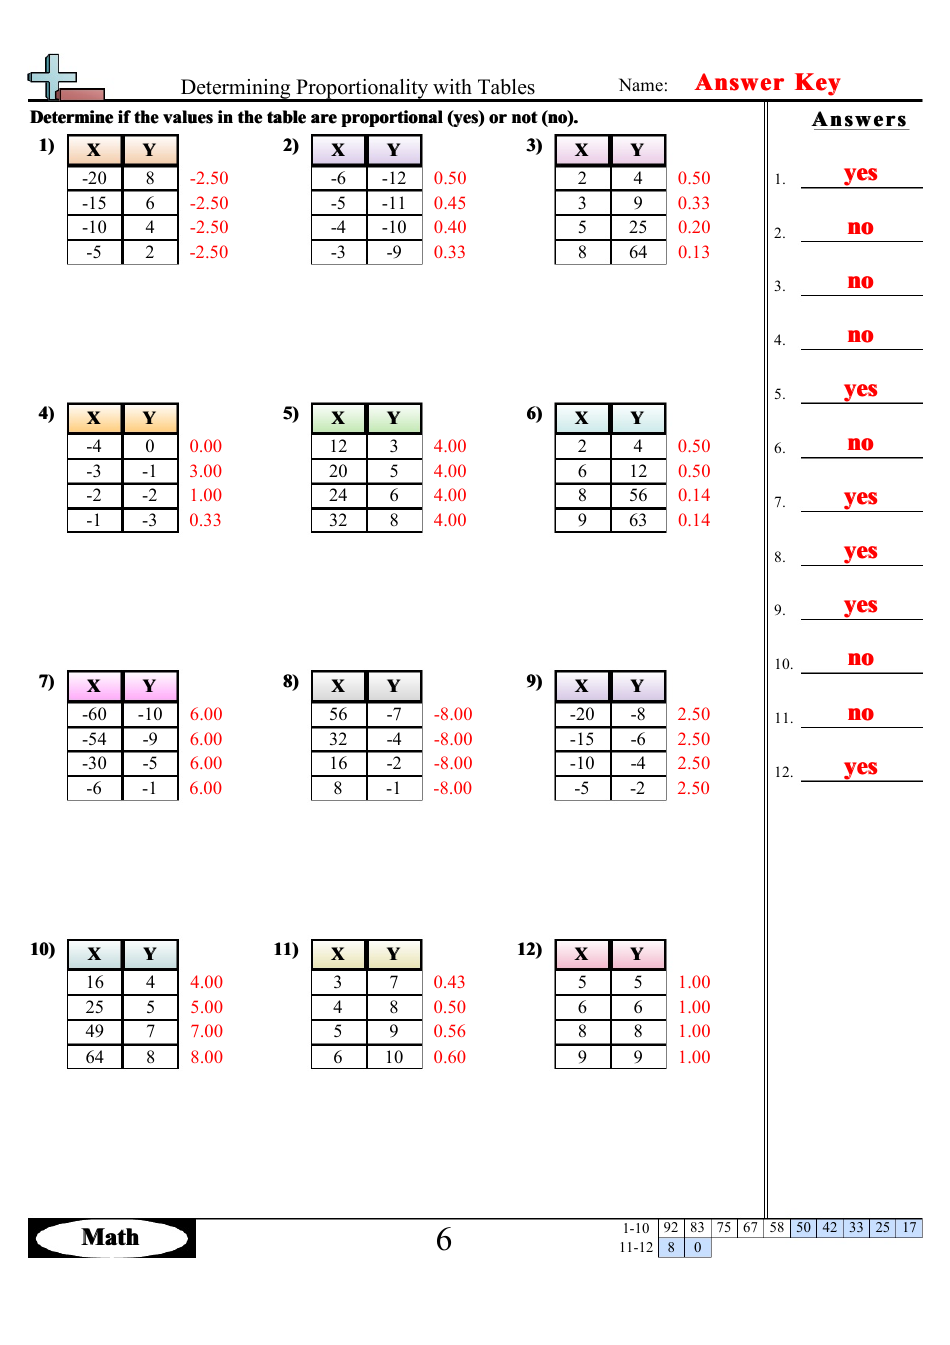
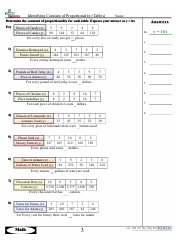
Determining Proportionality With Tables Worksheet With Answer Key
The Determining Proportionality With Tables Worksheet With Answer Key is a resource used in education to help students practice and assess their understanding of proportionality using tables. It provides exercises and includes an answer key for students to check their work.
FAQ
Q: What is Proportionality?
A: Proportionality is a relationship between two quantities that can be expressed by a ratio or a fraction.
Q: What is a table?
A: A table is a way to organize data in rows and columns.
Q: How can you determine proportionality with tables?
A: You can determine proportionality with tables by looking for a constant ratio between the values in each row or column.
Q: What is a constant ratio?
A: A constant ratio is a fixed ratio that remains the same throughout the table.
Q: How can you find the constant ratio in a table?
A: To find the constant ratio in a table, divide any value in one row or column by the corresponding value in another row or column.
Q: What does it mean if the constant ratio is the same?
A: If the constant ratio is the same for all rows or columns in a table, then the relationship is proportional.
Q: What does it mean if the constant ratio is different?
A: If the constant ratio is different for different rows or columns in a table, then the relationship is not proportional.
Q: What is an example of a proportional relationship in a table?
A: An example of a proportional relationship in a table is if the ratio of the values in each row or column is always the same.
Q: What is an example of a non-proportional relationship in a table?
A: An example of a non-proportional relationship in a table is if the ratio of the values in each row or column is different.
