Pie Charts
Pie charts are used to visually represent data and show the proportion or percentage of different categories or parts within a whole. They are particularly useful for representing categorical data and displaying the relationship between different parts or components of a whole. Pie charts are commonly used to present data in a clear and easy-to-understand manner, making it easier to compare and analyze the information being conveyed.
Documents:
1
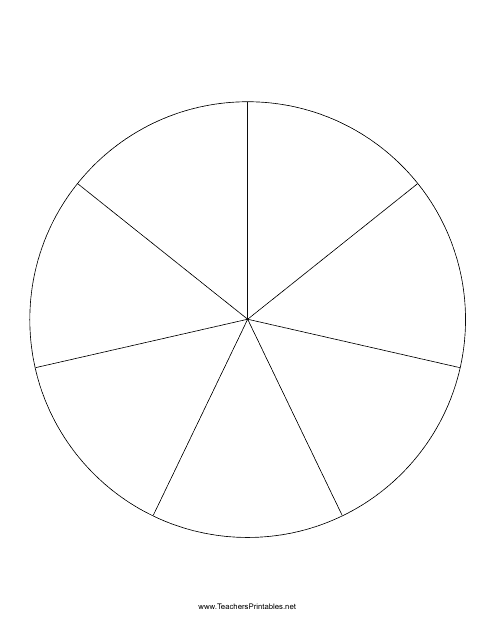
This type of document is a blank pie chart with 7 slices. It can be used to visually represent data or percentages in a pie chart format.

