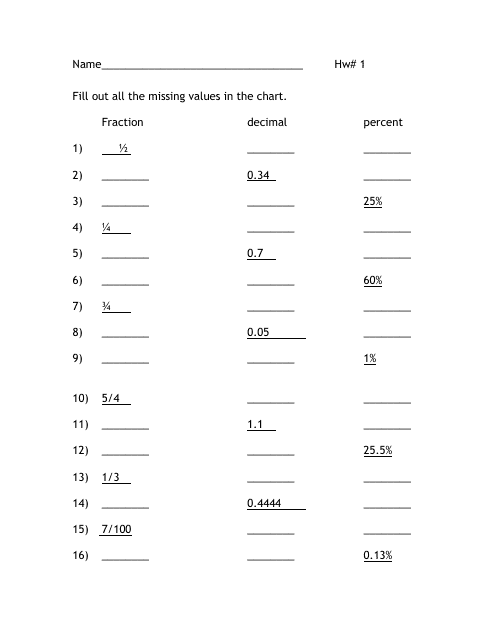
Fraction Decimal Percent Charts
A Fraction Decimal Percent Chart is a visual representation of the relationship between fractions, decimals, and percentages. It shows how fractions can be expressed as decimals and percentages, and how decimals can be converted into fractions and percentages as well. This chart helps in understanding and working with numerical values in different forms, making it easier to compare and convert between them.
Documents:
1
This worksheet helps you practice working with fractions, decimals, and percentages.

