Math Charts
Math charts are visual representations of mathematical concepts, formulas, or data that are used to aid in understanding and solving mathematical problems. They can be used as reference tools to quickly find information or as learning aids to help students grasp mathematical concepts more easily. Math charts can cover a wide range of topics, such as basic operations, geometry, algebra, trigonometry, and more. They provide a convenient and organized way to access key information and can be used in classrooms, at home, or for test preparation.
Documents:
22
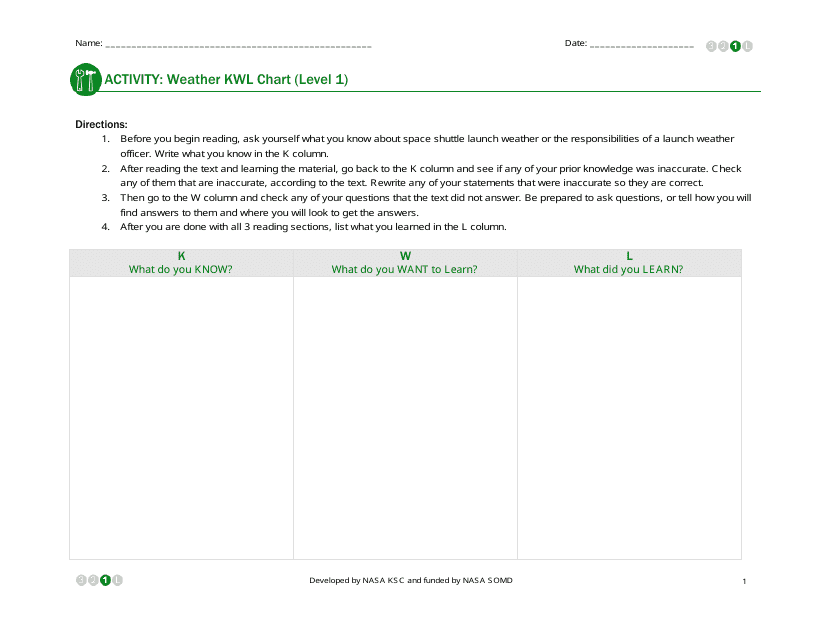
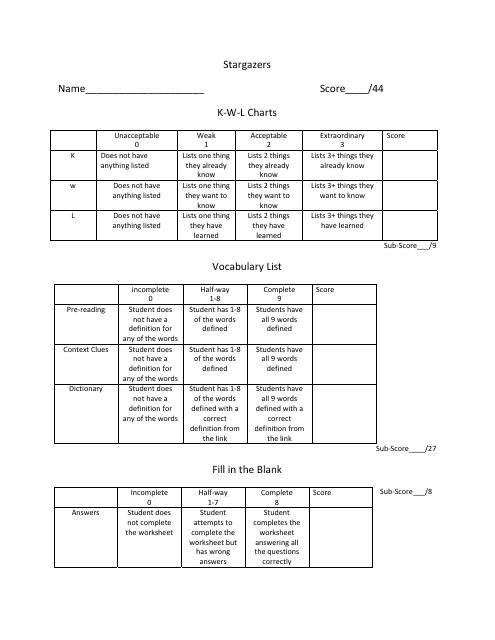
This type of document, known as student K-W-L charts, is used for organizing and tracking what a student knows, wants to know, and has learned about a particular topic. It helps students engage in active learning and reflect on their own knowledge and understanding.
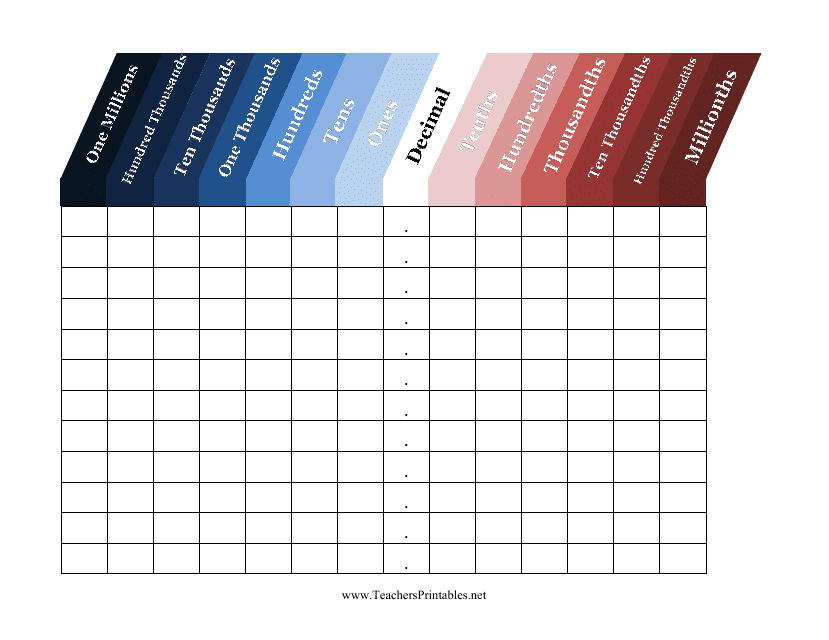
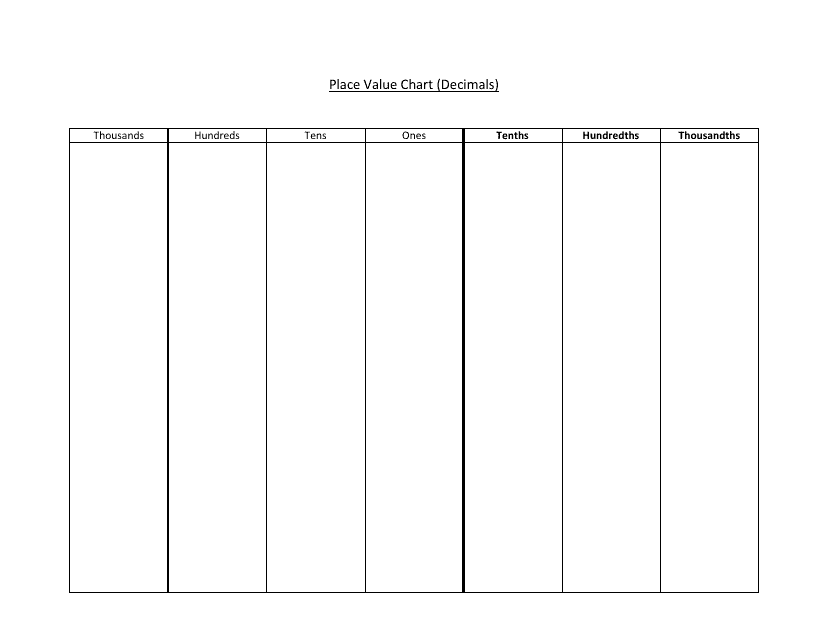
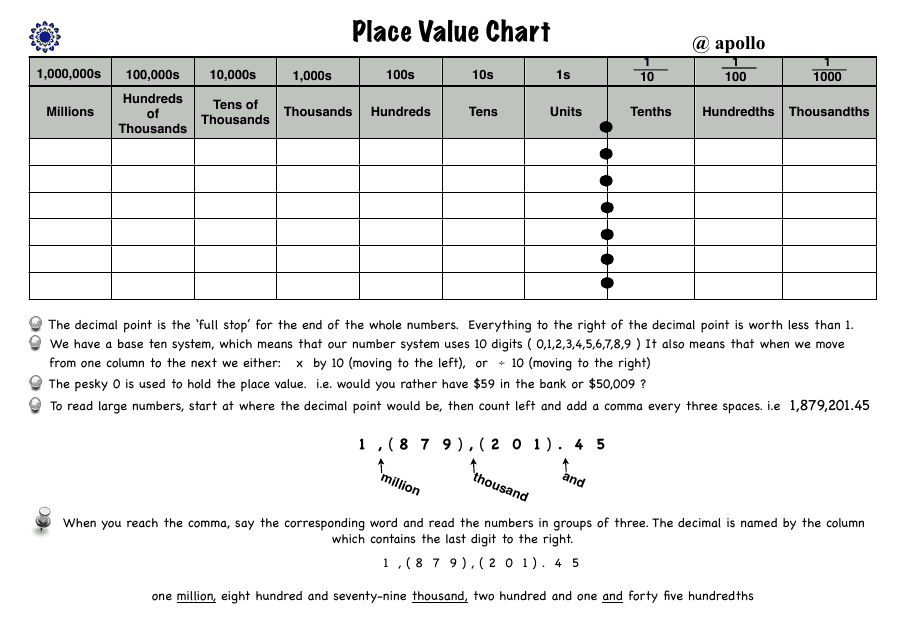
This document provides a template for creating a decimal place value chart. Use it to organize and understand the value of each digit in a decimal number.
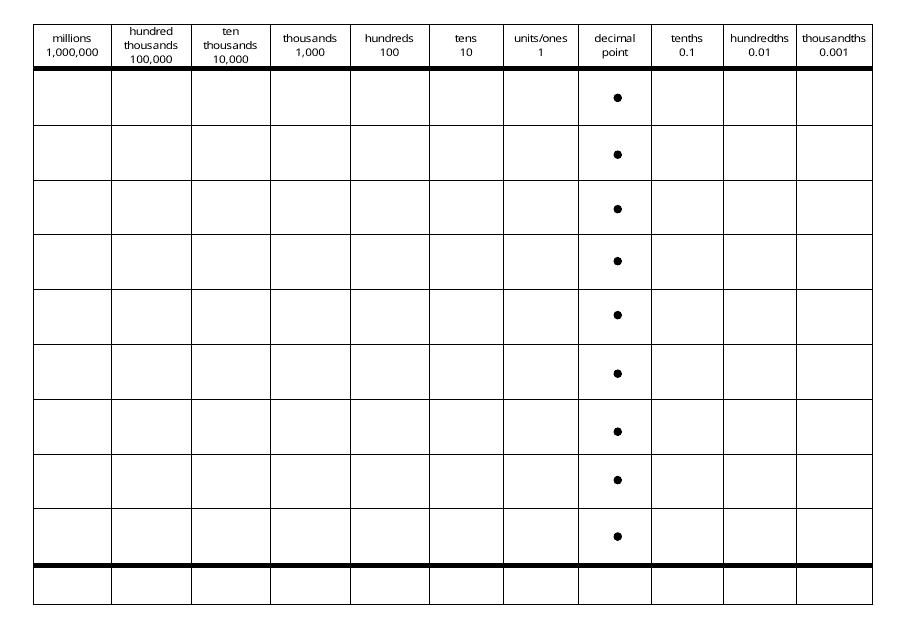
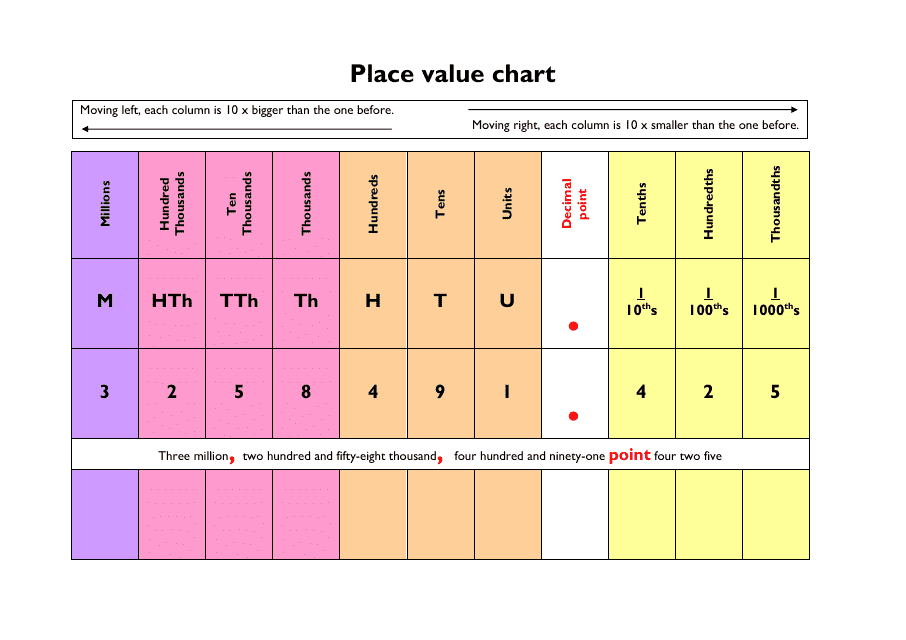
This document provides a template for a place value chart from millions to thousandths. It helps in understanding and organizing numbers in different decimal places.
This document is useful for teaching and practicing place value concepts in mathematics.
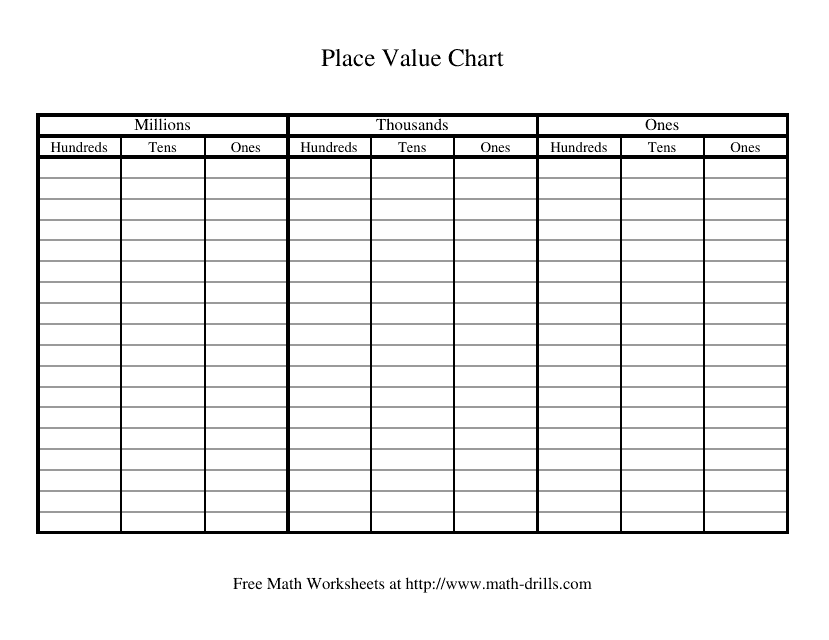
This type of document is a place value chart that helps in understanding the value of numbers in the millions, thousands, and ones places.
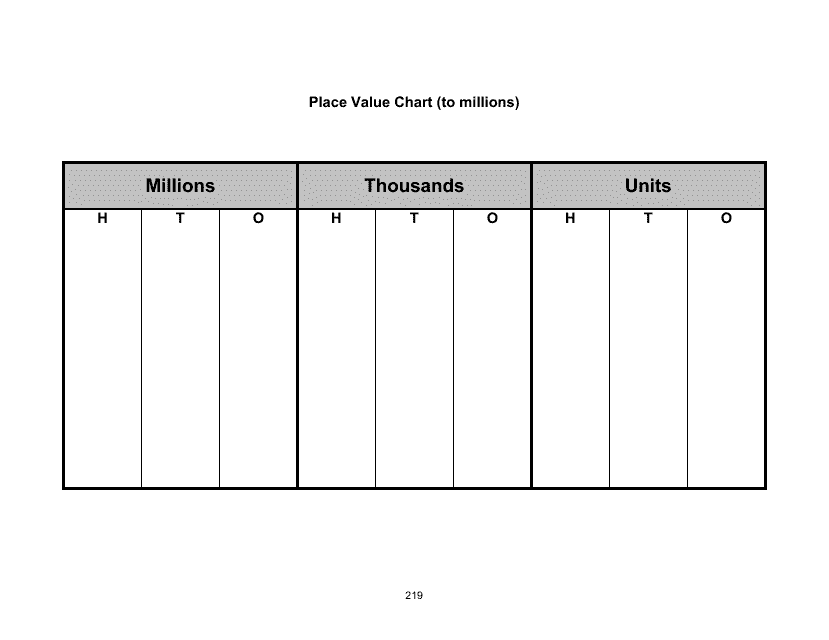
This document provides a template for a millions place value chart, which is used to help understand and visualize numbers up to the millions place.
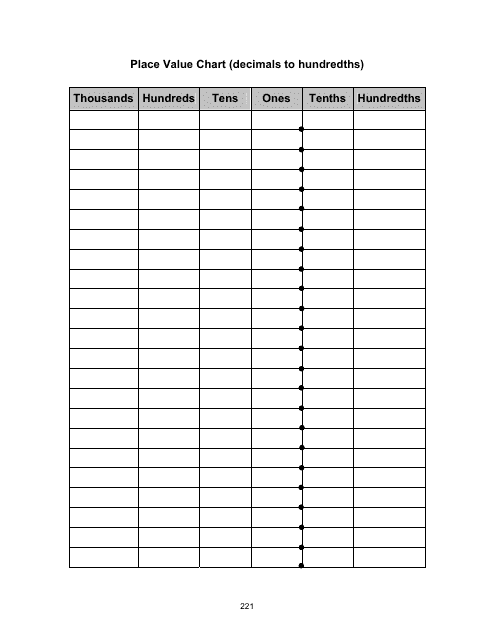
This type of document provides a chart that shows the decimal values up to the hundredths place.
This document provides a chart that shows the place values for decimals.
This document provides a template of a place value chart. It is used to help understand and visualize the value of each digit in a number. This tool is often used in math education and can be helpful for students learning about place value.
This type of document is a place value chart specific to the state of Alabama. It helps in understanding the value of digits in numbers.
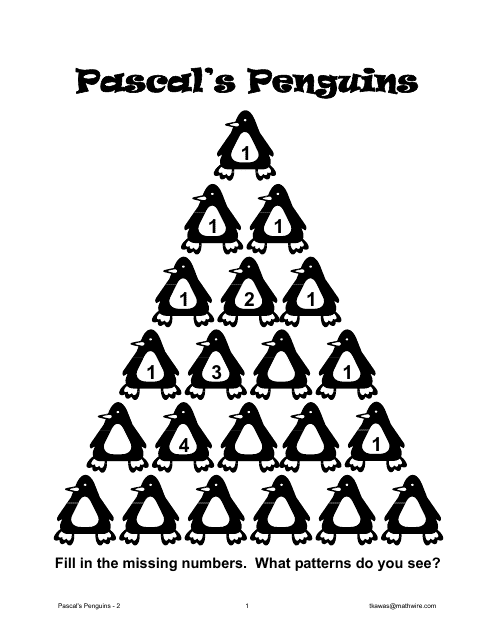
This type of document is a kids activity sheet with a penguin theme. It features a missing number puzzle based on Pascal's Triangle. It also includes an answer key to check the solution. Perfect for educational and fun activities for children.
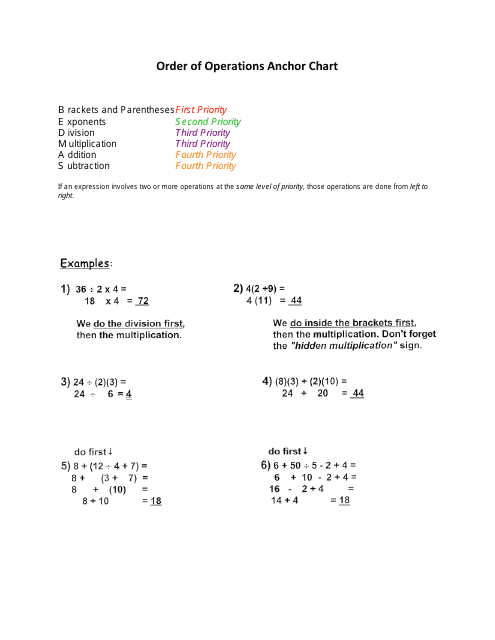
This document provides an anchor chart that explains the order of operations in mathematics. It helps students remember the correct sequence to follow when solving mathematical expressions.
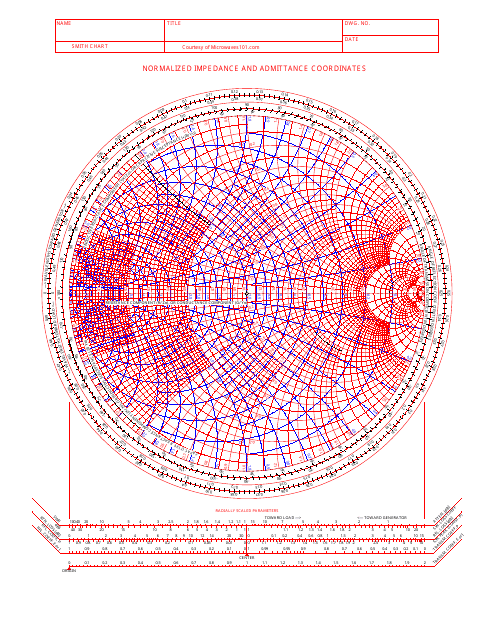
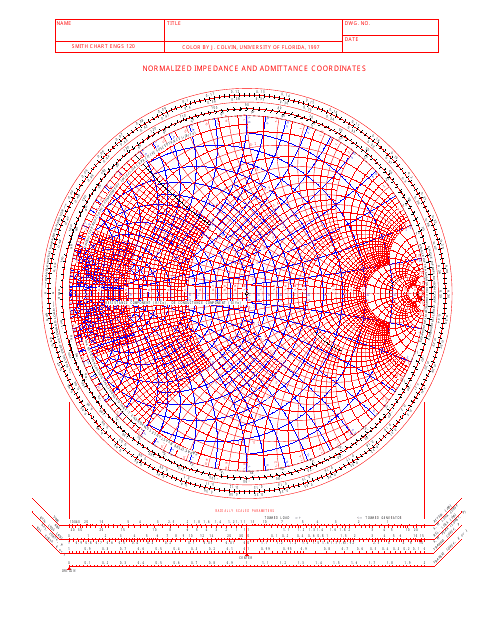
This chart is used to visualize normalized impedance and admittance coordinates in electrical engineering. It helps in analyzing and designing RF and microwave circuits.
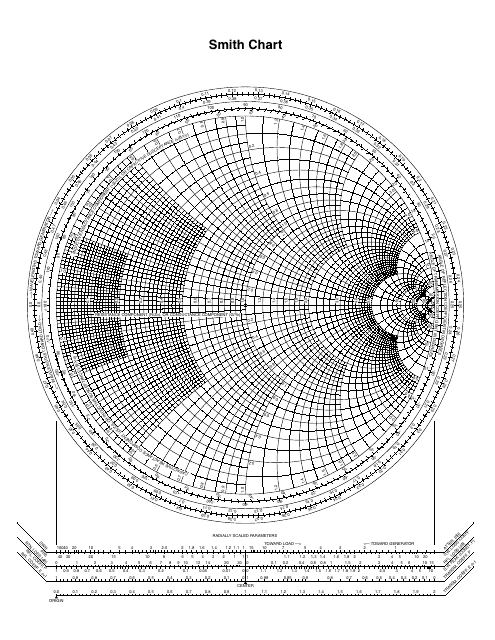
This document explains the Smith Chart, a graphical tool used in electrical engineering to represent impedance and admittance values in a normalized form.
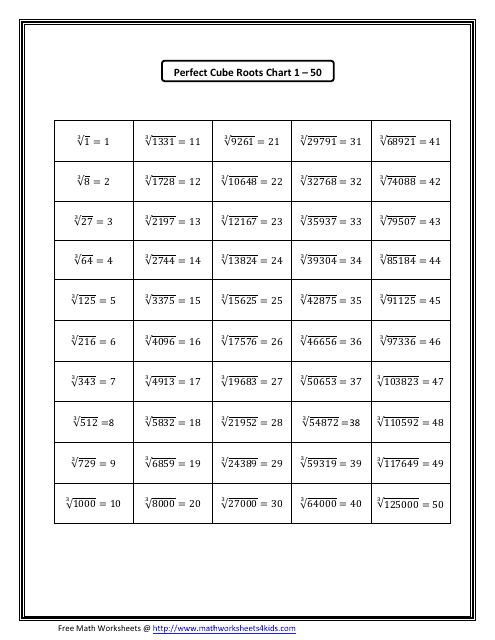
This Form is used for finding the cube roots of numbers from 1 to 50. It provides a chart that lists the perfect cube roots of these numbers.
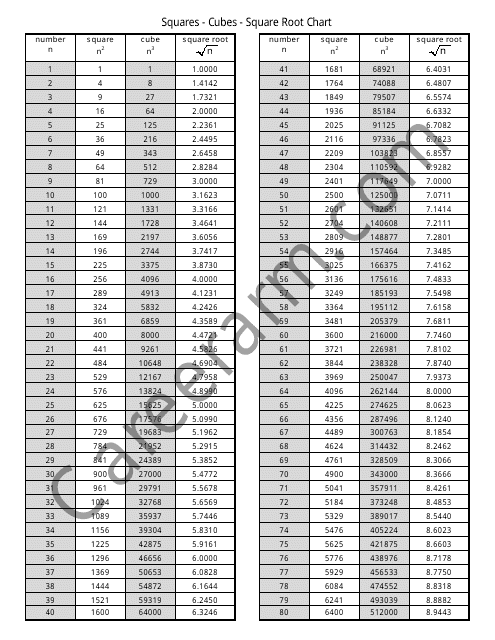
This document provides a chart that lists the squares, cubes, and square roots of various numbers. It is useful for gaining a quick reference to these mathematical calculations.
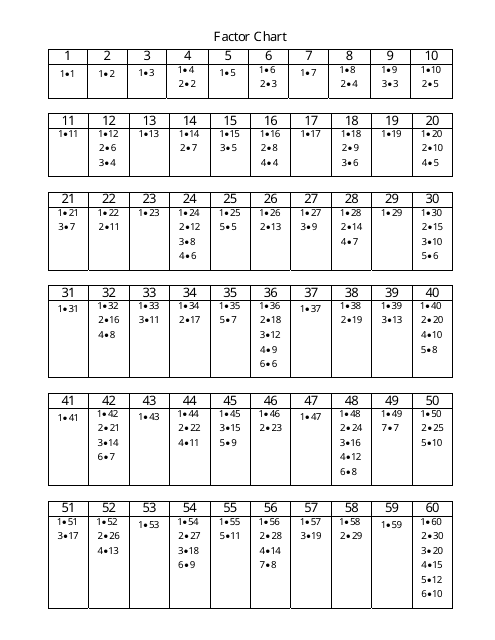
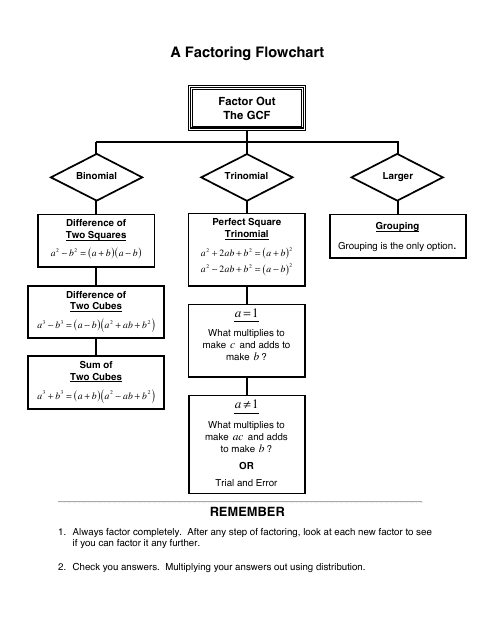
This document provides a reference sheet for factoring, a method used in business finance to convert accounts receivable into immediate cash. It includes formulas, examples, and tips for effective factoring.
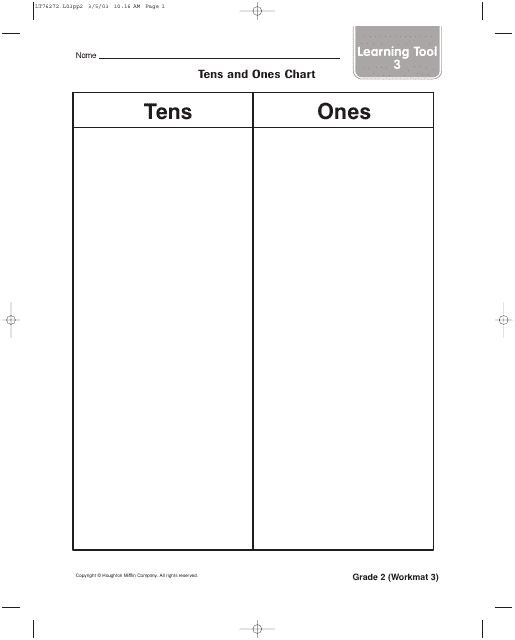
This document is a template for a Tens and Ones Chart, which is a learning tool for 2nd grade students. It is part of the Houghton Mifflin Math curriculum and is used in the United Kingdom.
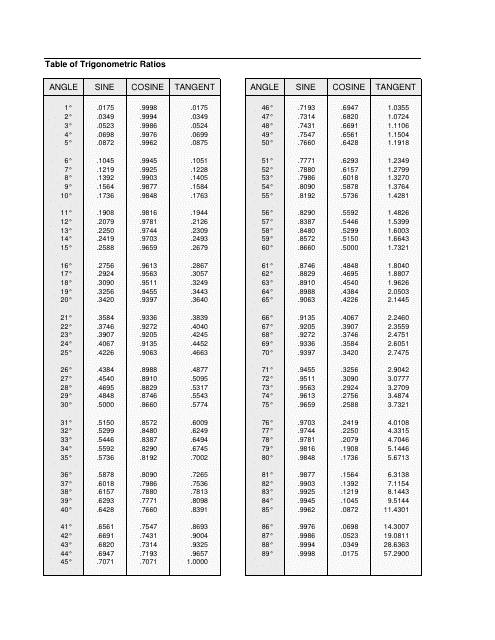
This document provides a handy reference guide for the different trigonometric ratios used in trigonometry calculations. It outlines the relationships between the angles of a triangle and their corresponding ratios such as sine, cosine, and tangent.

