Table Charts
Table charts are used to organize and present data in a structured format. They are visual representations of information that can help in analyzing and comparing data points. Table charts are commonly used to display numerical data, such as sales figures, survey results, or scientific data. They provide an easy-to-read format that allows for quick comprehension and identification of trends or patterns within the data.
Documents:
1
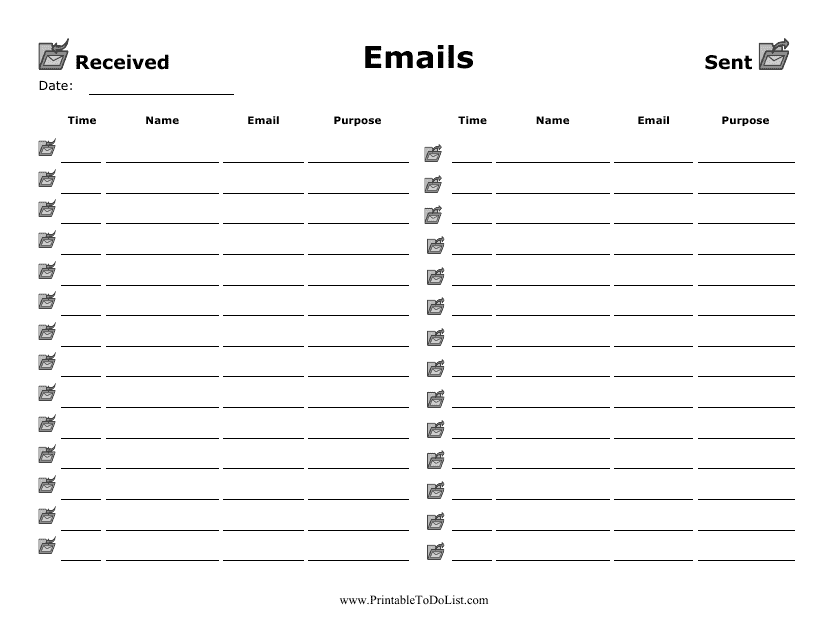
This type of document is a template for tracking incoming and outgoing emails. Keep a record of important emails for easier organization and reference.

