Polar Graph Templates
Are you in need of a convenient tool for creating and visualizing polar graphs? Look no further than our comprehensive collection of polar graph resources. Whether you're a student, teacher, or professional, our polar graph templates and charts will help you effortlessly plot and analyze data points in a polar coordinate system.
Our polar graph paper is designed to accommodate a wide range of applications. From simple sphere plots to more complex polar curves, our templates provide a convenient framework to bring your ideas to life. Whether you need a printable version for offline use or a digital template for on-screen editing, our collection has you covered.
With the help of our polar graphing resources, you can easily understand and visualize the relationships between variables in a polar coordinate system. Gone are the days of manually drawing polar graphs; our templates will save you time and effort by providing a ready-to-go grid that fits your specific needs.
In addition to their practical uses, our polar graph collection can also be utilized for educational purposes. Teachers and students alike can benefit from our cheat sheets and project templates, which provide a visually appealing guide for learning and showcasing polar graph concepts.
So, whether you're a math enthusiast, an engineering student, or someone who simply loves graphing data in a unique way, our polar graph resources are here to assist you. Take advantage of our printable templates, charts, and cheat sheets, and discover the beauty and versatility of the polar coordinate system. Start exploring our collection today and unlock a world of boundless graphing possibilities.
Documents:
14
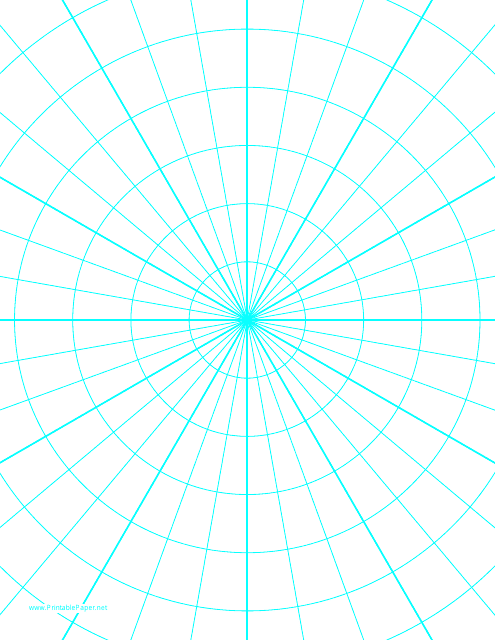
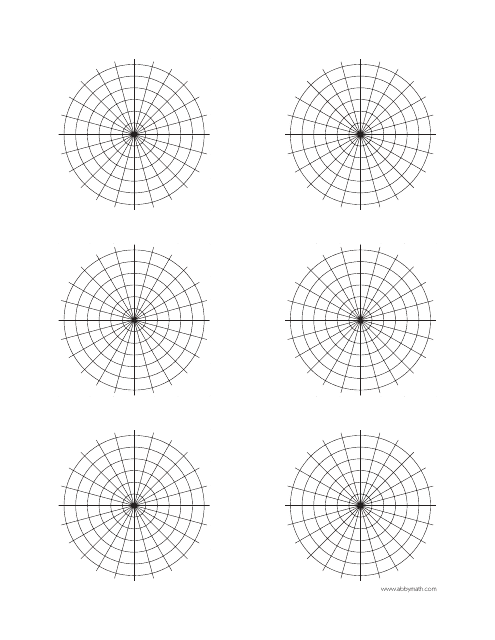
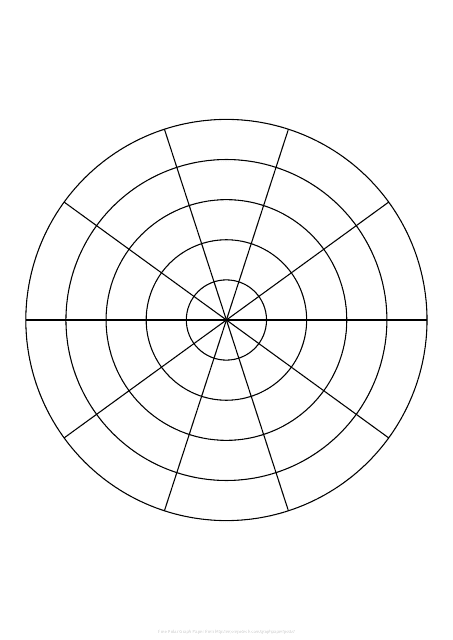
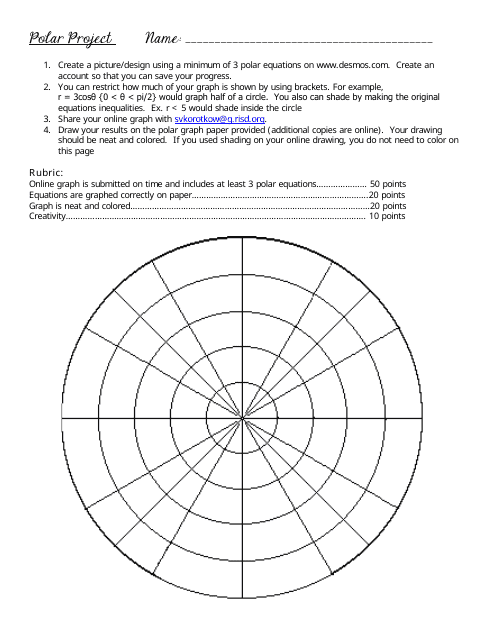
This type of document provides printable ray-style polar graph paper, typically used for creating circular or angle-based mathematical diagrams and plots. It's ideal for students, teachers or anyone needing to create complex patterns related to polar coordinates.
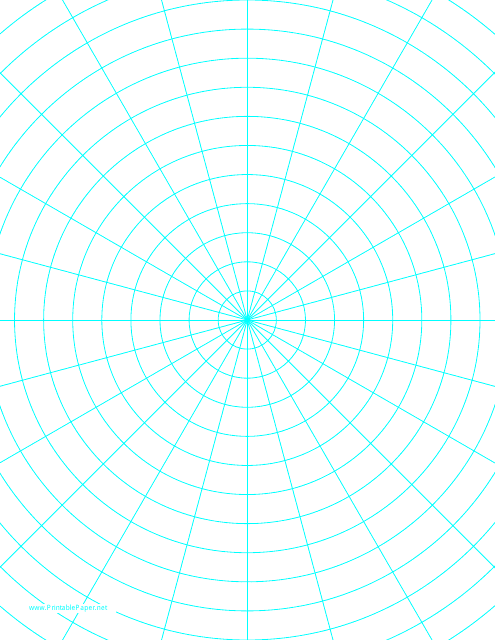
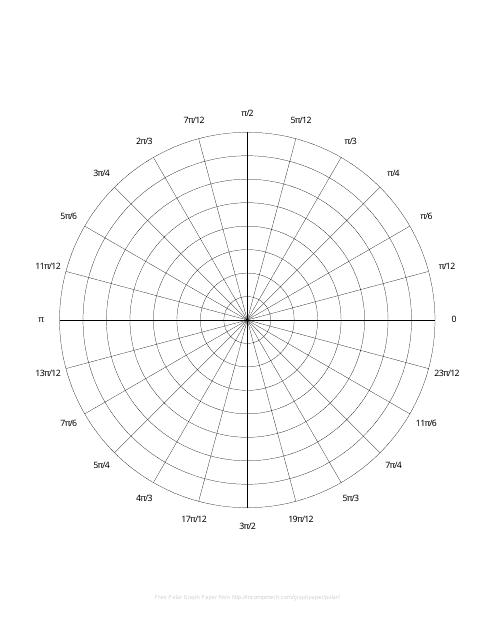
This document typically includes printable or digitally interactive graph paper featuring concentric circles divided into small arcs or 'pie wedges' helpful in plotting polar coordinates, functions, and experimental data in mathematical, engineering, and physical sciences studies.
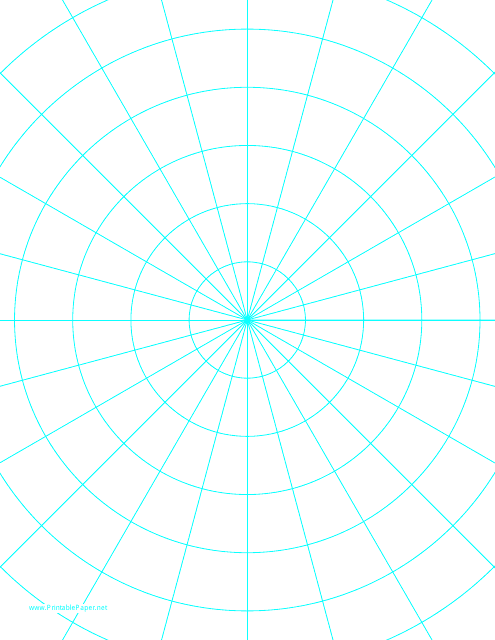
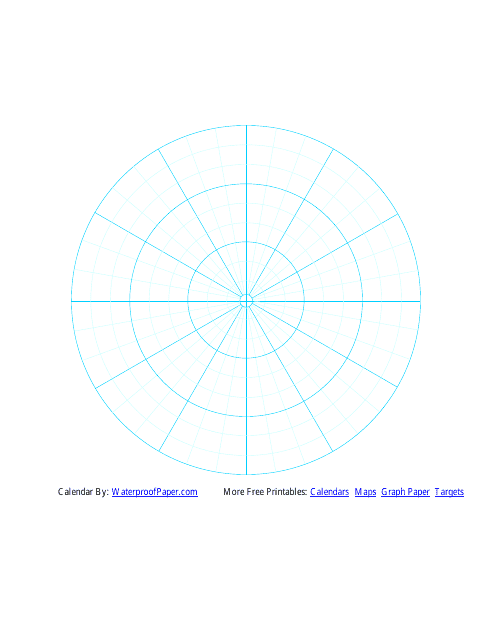
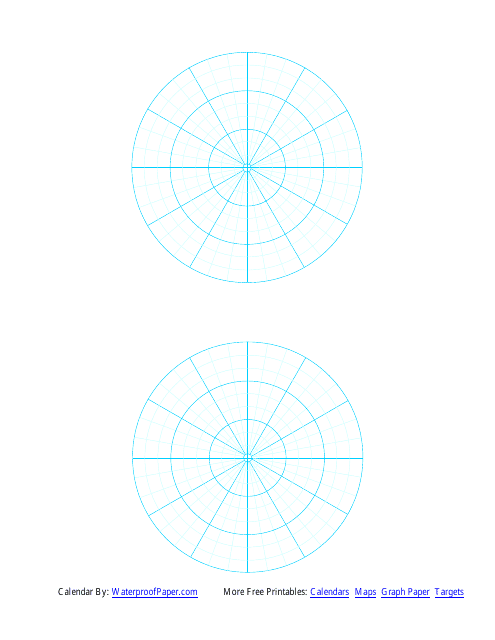
This document is a template for cyan polar graph paper. It is used for plotting points and drawing graphs with polar coordinates.
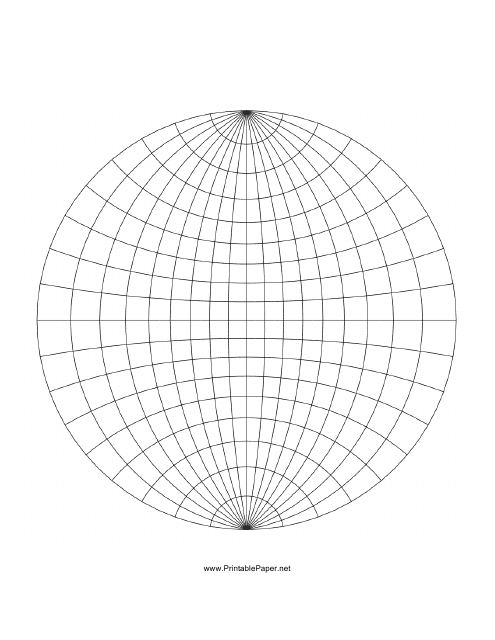
This document provides a printable template for polar graph paper in a spherical form. It is typically used for plotting three-dimensional spherical coordinates in mathematics or physics.
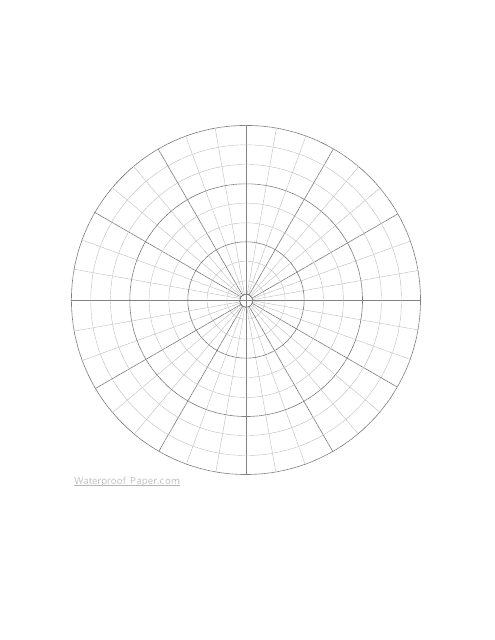
This document is designed to provide waterproof polar graph paper which comes in handy for geometric calculations, navigational & weather data plotting or any mathematical functions requiring polar coordinates, retaining its utility even in wet conditions.
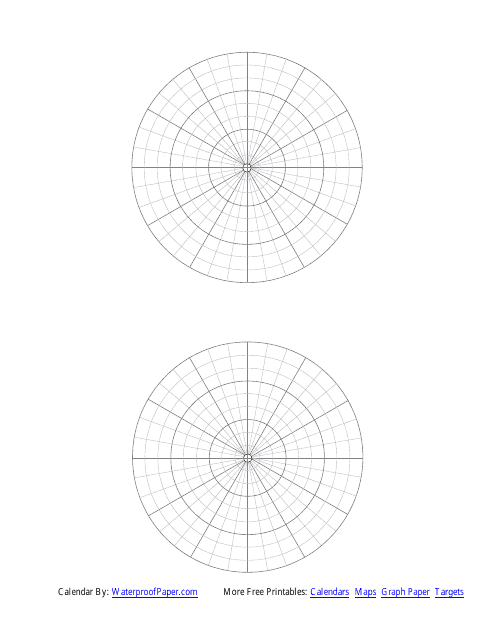
This type of document is a specialized kind of graph paper which is used in mathematics and engineering fields for plotting polar coordinates, graphing, and experimental data. The 'Two Vertical' signifies the presence of two vertical axes for plotting values.
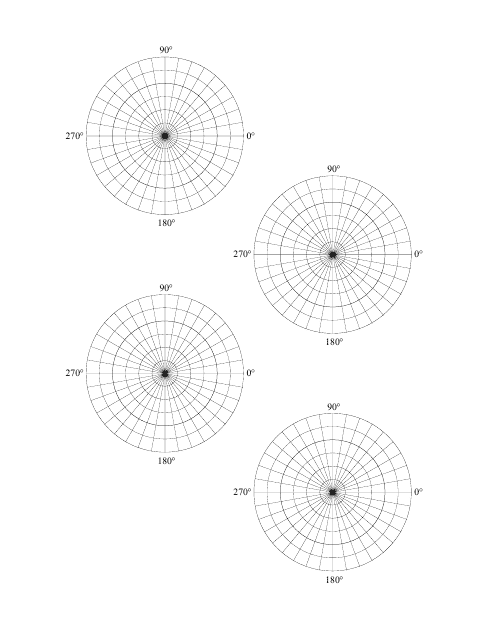
This type of document provides a template of polar graph paper, typically used in mathematics or engineering for clockwise direction graphing with perfect spacing for neat and accurate drawing. Suitable for plotting radial coordinate diagrams, it divides the field into two sectors for added detail and specificity.
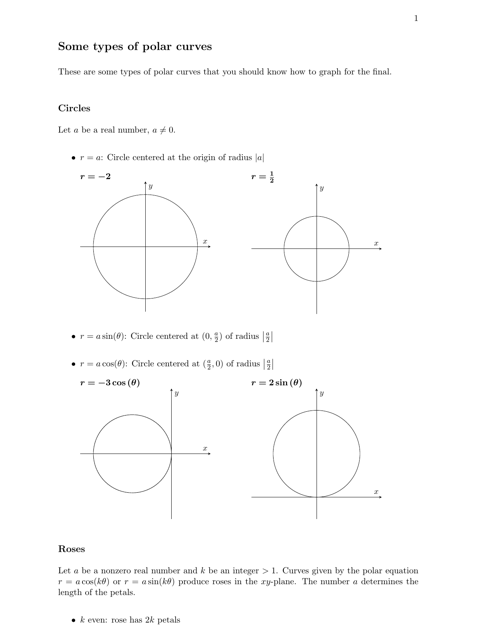
This cheat sheet provides a quick reference guide for understanding and working with polar curves, which are mathematical representations of curves in polar coordinates. It includes key formulas, properties, and example problems.

