Free Log Paper Templates
What Is Log Paper?
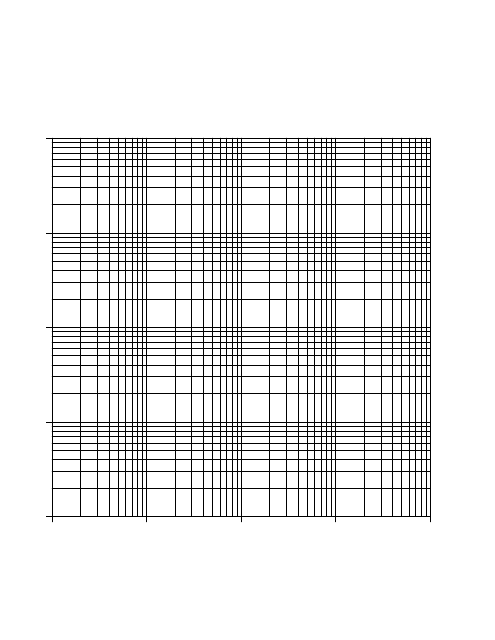
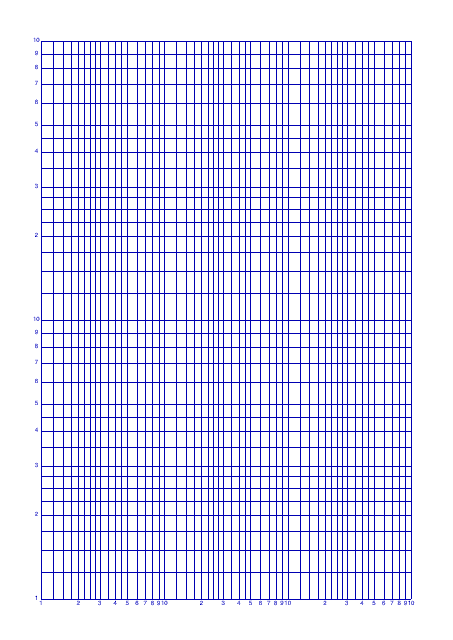
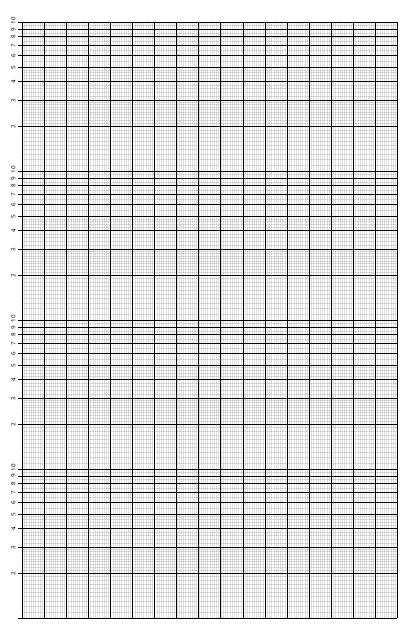
Log Paper is a type of graph paper that is employed for summarizing information with a broad spectrum of numbers. The sheet contains an array of squares, each reflecting a certain range of numbers that are organized in a particular manner.
Alternate Name:
- Logarithmic Paper.
It is a particularly superb tool for researchers, engineers, and other specialists that deal with gigantic or complicated databases since it has been created to handle data that changes across multiple orders. Data that might be challenging or impossible to adequately portray on regular graph paper can be plotted on log paper. You need to:
- Choose the proper range of values to represent the information you have to begin using log paper;
- After that, display the information using the paper's grid of squares, being sure to carefully consider the squares' size and placement to make sure that it appropriately reflects the information you have on hand.
Plotting the results of scientific studies, evaluating economic information, and producing graphical representations for corporate presentations are just a few examples of the many uses for log sheets. They provide a practical and simple approach that spans an extensive variety of integers.
It provides a simple yet precise way to depict complicated information in a basic easy-to-understand way, making it a useful tool for many different types of professions that frequently interact with vast amounts of data. It may require some time to get your head around everything, so we suggest you do this before you begin plotting any information out. Once you figure everything out for yourself and get accustomed to the sheet, you will realize just how much of a lifesaver it is.
For a full list of Log Paper templates please feel free to check out our library below.
Still looking for a particular template? Take a look at the related templates below:
Documents:
12
This type of document is a template for cyan-colored graph paper. It can be used for drawing or plotting various mathematical functions or creating graphs.
This type of document is a cyan semi-log paper template with 18 divisions. It is commonly used for creating graphs and charts that require a logarithmic scale.
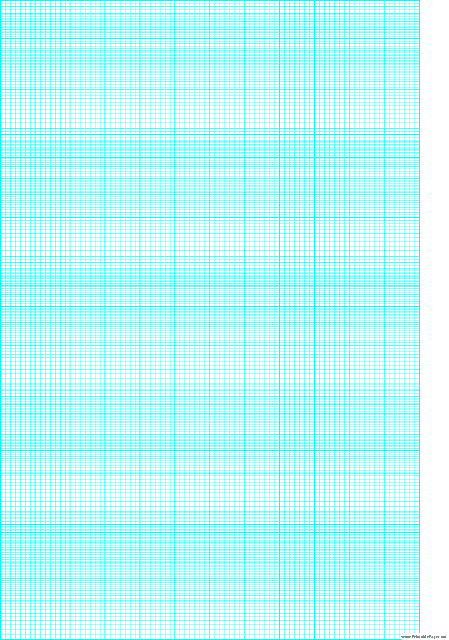
This template is used for creating Cyan Semi-log Paper with 36 divisions by 3-cycles.
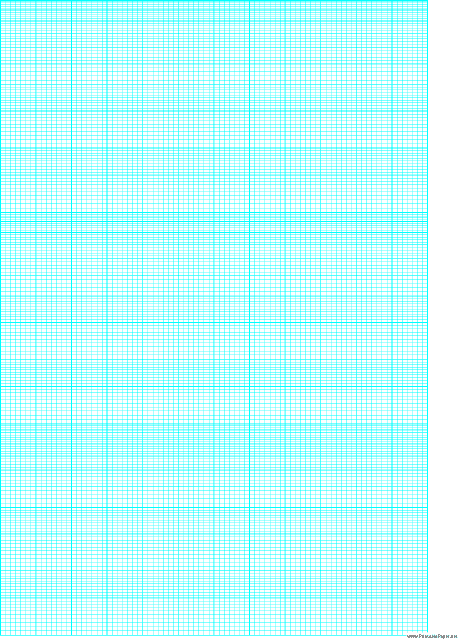
This document is a cyan semi-log paper template with 12 divisions by 5 cycles. It is used for plotting exponential and logarithmic functions in a graphical format.
This document is a template for cyan semi-log paper with 12 divisions by 3-cycles. It is used for graphing data that spans a wide range of values.
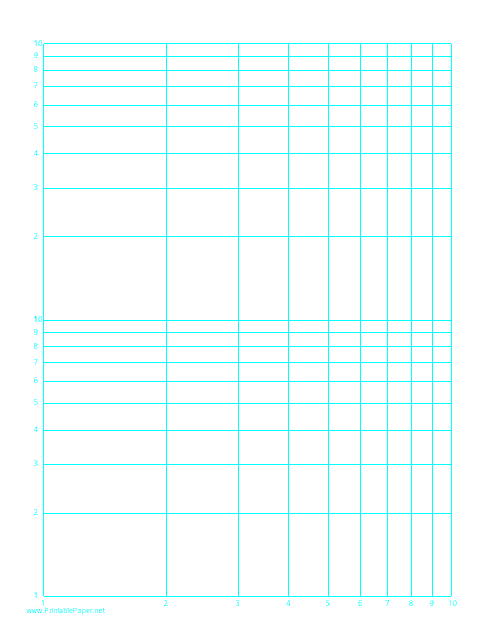
This document is a cyan log-log paper template with a logarithmic horizontal axis spanning one decade and a logarithmic vertical axis spanning two decades. It is used for plotting data with logarithmic scales.
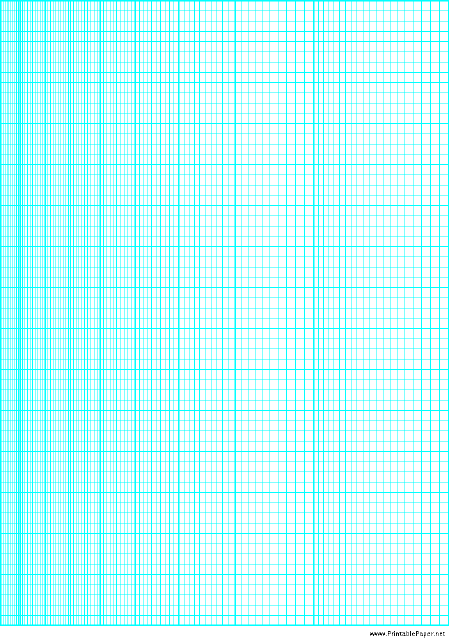
This document provides a template of cyan semi-log paper, commonly used for graphing data with a logarithmic scale.

